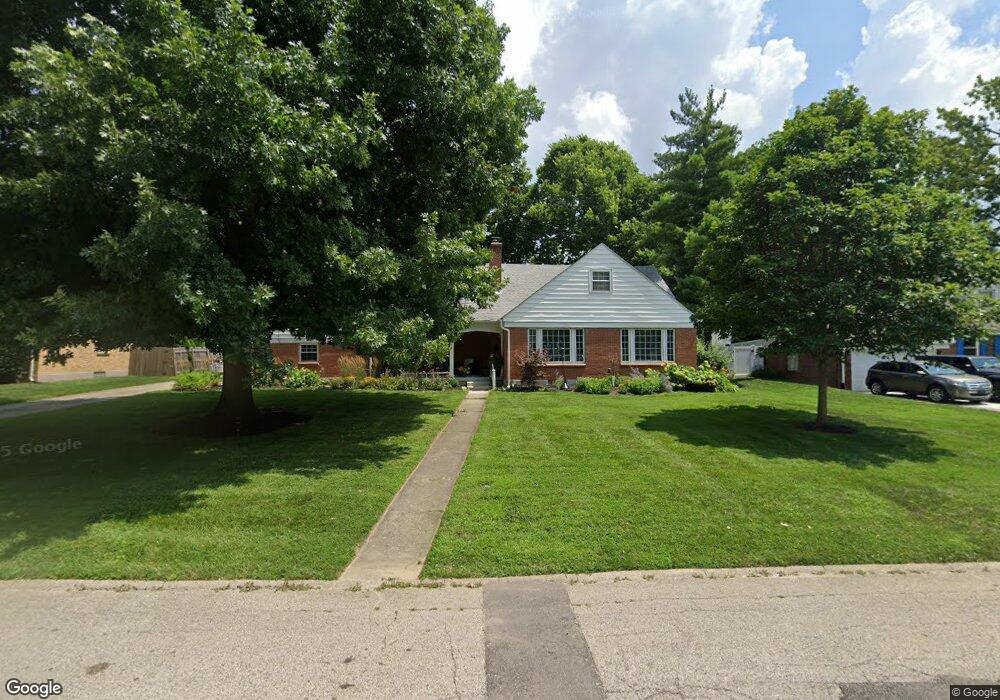
3208 Atherton Rd Dayton, OH 45409
Estimated Value: $421,000 - $484,562
4
Beds
2
Baths
2,108
Sq Ft
$213/Sq Ft
Est. Value
About This Home
This home is located at 3208 Atherton Rd, Dayton, OH 45409 and is currently estimated at $448,641, approximately $212 per square foot. 3208 Atherton Rd is a home located in Montgomery County with nearby schools including Southdale Elementary School, Van Buren Middle School, and Kettering Fairmont High School.
Ownership History
Date
Name
Owned For
Owner Type
Purchase Details
Closed on
Dec 13, 2019
Sold by
Sorrell Patricia L
Bought by
Sorrell Patricia L and Sorrell Patricia L
Current Estimated Value
Purchase Details
Closed on
Apr 29, 2019
Sold by
Sales Doug K and Sales Kathleen K
Bought by
Sorrell Patricia L
Home Financials for this Owner
Home Financials are based on the most recent Mortgage that was taken out on this home.
Original Mortgage
$228,000
Outstanding Balance
$200,458
Interest Rate
4.2%
Mortgage Type
New Conventional
Estimated Equity
$248,183
Purchase Details
Closed on
Jul 10, 1998
Sold by
Olt Louis E
Bought by
Dawson Ed and Dawson Nancy
Home Financials for this Owner
Home Financials are based on the most recent Mortgage that was taken out on this home.
Original Mortgage
$130,000
Interest Rate
7.17%
Mortgage Type
Seller Take Back
Create a Home Valuation Report for This Property
The Home Valuation Report is an in-depth analysis detailing your home's value as well as a comparison with similar homes in the area
Home Values in the Area
Average Home Value in this Area
Purchase History
| Date | Buyer | Sale Price | Title Company |
|---|---|---|---|
| Sorrell Patricia L | -- | None Available | |
| Sorrell Patricia L | $285,000 | Sterling Land Title Agcy Inc | |
| Dawson Ed | -- | -- | |
| Dawson Ed | $130,000 | -- |
Source: Public Records
Mortgage History
| Date | Status | Borrower | Loan Amount |
|---|---|---|---|
| Open | Sorrell Patricia L | $228,000 | |
| Previous Owner | Dawson Ed | $130,000 |
Source: Public Records
Tax History Compared to Growth
Tax History
| Year | Tax Paid | Tax Assessment Tax Assessment Total Assessment is a certain percentage of the fair market value that is determined by local assessors to be the total taxable value of land and additions on the property. | Land | Improvement |
|---|---|---|---|---|
| 2024 | $7,492 | $150,620 | $20,230 | $130,390 |
| 2023 | $7,492 | $121,090 | $20,230 | $100,860 |
| 2022 | $6,819 | $87,140 | $14,550 | $72,590 |
| 2021 | $6,305 | $87,140 | $14,550 | $72,590 |
| 2020 | $6,325 | $87,140 | $14,550 | $72,590 |
| 2019 | $5,285 | $64,350 | $13,880 | $50,470 |
| 2018 | $5,313 | $64,350 | $13,880 | $50,470 |
| 2017 | $4,893 | $64,350 | $13,880 | $50,470 |
| 2016 | $4,402 | $54,380 | $13,880 | $40,500 |
| 2015 | $4,205 | $54,380 | $13,880 | $40,500 |
| 2014 | $4,205 | $54,380 | $13,880 | $40,500 |
| 2012 | -- | $47,440 | $13,860 | $33,580 |
Source: Public Records
Map
Nearby Homes
- 1151 Brookview Ave
- 1125 Laurelwood Rd
- 3101 Allendale Dr
- 3464 Southern Blvd
- 1314 Ridgeview Ave
- 3060 Regent St
- 1129 W Dorothy Ln
- 1364 Elmdale Dr
- 3225 Southdale Dr Unit 1
- 1424 Elmdale Dr
- 3720 Ridgeleigh Rd Unit D
- 2934 Robin Rd
- 3325 Ridgeway Rd
- 1554 Crescent Blvd
- 3073 Hillside Ave
- 321 E Dorothy Ln
- 1545 Cardington Rd
- 311 Parkdale St Unit 309
- 3915 Utica Dr
- 1524 Hillwood Dr
- 3200 Atherton Rd
- 3216 Atherton Rd
- 3217 Southern Blvd
- 3233 Southern Blvd
- 3150 Atherton Rd
- 3224 Atherton Rd
- 3201 Southern Blvd
- 3209 Atherton Rd
- 3249 Southern Blvd
- 1150 Brookview Ave
- 3217 Atherton Rd
- 3225 Atherton Rd
- 3181 Southern Blvd
- 3265 Southern Blvd
- 3142 Atherton Rd
- 3233 Atherton Rd
- 3212 Fairway Dr
- 3218 Fairway Dr
- 3206 Fairway Dr
- 3165 Southern Blvd