Estimated Value: $121,359 - $261,000
--
Bed
--
Bath
993
Sq Ft
$225/Sq Ft
Est. Value
About This Home
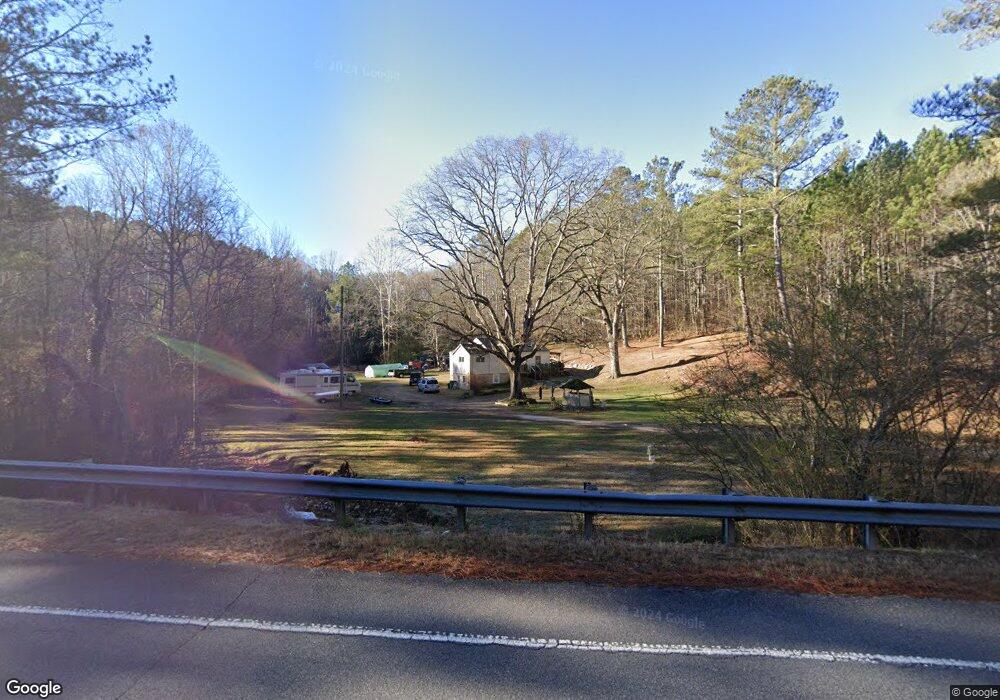
This home is located at 3208 Chulio Rd SE, Rome, GA 30161 and is currently estimated at $223,840, approximately $225 per square foot. 3208 Chulio Rd SE is a home located in Floyd County with nearby schools including Pepperell Middle School and Pepperell High School.
Ownership History
Date
Name
Owned For
Owner Type
Purchase Details
Closed on
May 23, 2000
Bought by
P and R
Current Estimated Value
Purchase Details
Closed on
Apr 15, 1996
Sold by
Sanders David
Bought by
Sanders David and Sanders Kathy Y
Purchase Details
Closed on
Apr 1, 1991
Sold by
Sanders David & Lynda W Life Estate To J
Bought by
Sanders David
Purchase Details
Closed on
Jun 24, 1987
Bought by
P and R
Purchase Details
Closed on
Nov 4, 1983
Sold by
Sanders Joyce E
Bought by
Sanders David & Lynda W Life Estate To J
Purchase Details
Closed on
Apr 27, 1977
Bought by
P and R
Purchase Details
Closed on
Apr 6, 1977
Sold by
Sanders Van F
Bought by
Sanders Joyce E
Purchase Details
Closed on
Jan 1, 1968
Sold by
Tom Port
Bought by
Sanders Van F
Purchase Details
Closed on
Jan 1, 1965
Sold by
Harold C Southard
Bought by
Tom Port
Purchase Details
Closed on
Jan 1, 1964
Sold by
Julia John W and Julia Wilbanks Et Al Julia B Wi
Bought by
Harold C Southard
Purchase Details
Closed on
Jan 1, 1963
Bought by
Julia John W and Julia Wilbanks Et Al Julia
Create a Home Valuation Report for This Property
The Home Valuation Report is an in-depth analysis detailing your home's value as well as a comparison with similar homes in the area
Home Values in the Area
Average Home Value in this Area
Purchase History
| Date | Buyer | Sale Price | Title Company |
|---|---|---|---|
| P | -- | -- | |
| Sanders David | -- | -- | |
| Sanders David | -- | -- | |
| P | -- | -- | |
| Sanders David & Lynda W Life Estate To J | -- | -- | |
| P | -- | -- | |
| Sanders Joyce E | $13,000 | -- | |
| Sanders Van F | $1,800 | -- | |
| Tom Port | $1,700 | -- | |
| Harold C Southard | -- | -- | |
| Julia John W | -- | -- |
Source: Public Records
Tax History Compared to Growth
Tax History
| Year | Tax Paid | Tax Assessment Tax Assessment Total Assessment is a certain percentage of the fair market value that is determined by local assessors to be the total taxable value of land and additions on the property. | Land | Improvement |
|---|---|---|---|---|
| 2024 | -- | $38,616 | $22,261 | $16,355 |
| 2023 | $0 | $36,042 | $20,238 | $15,804 |
| 2022 | $640 | $28,183 | $16,684 | $11,499 |
| 2021 | $580 | $24,512 | $15,158 | $9,354 |
| 2020 | $533 | $21,971 | $13,182 | $8,789 |
| 2019 | $518 | $21,406 | $13,182 | $8,224 |
| 2018 | $496 | $20,273 | $12,554 | $7,719 |
| 2017 | $476 | $19,198 | $11,624 | $7,574 |
| 2016 | $480 | $19,122 | $11,600 | $7,522 |
| 2015 | $471 | $19,122 | $11,600 | $7,522 |
| 2014 | $471 | $19,122 | $11,600 | $7,522 |
Source: Public Records
Map
Nearby Homes
- 3810 Chulio Rd SE
- 0 Powell Rd SE Unit 10606945
- 375 Druid Rd SE
- 344 Powell Rd SE
- 0 Satcher Rd Unit 10626187
- 0 Satcher Rd Unit 7666911
- 0 Satcher Rd Unit 19425114
- 0 Satcher Rd Unit 4 19430080
- 0 Satcher Rd Unit 4 20170176
- 0 Satcher Rd Unit 1 20170093
- 00 Satcher Rd
- 16 Unbridled Rd Unit 22
- 16 Unbridled Rd
- 20 Satcher Rd
- 00000 Satcher Rd
- 1561 Pleasant Valley Rd SE
- 142 Ellis Rd SE
- 2209 Euharlee Rd
- 0 Hillindale Dr SE Unit 10515824
- 0 Hillindale Dr SE Unit 7574083
- 3148 Chulio Rd SE
- 3153 Chulio Rd SE
- 304 Lexington Ln SE
- 305 Lexington Ln SE
- 103 Lovell Rd SE
- 45 Lovell Rd SE
- 75 Lovell Rd SE
- 87 Lovell Rd SE
- 63 Lovell Rd SE
- 292 Lexington Ln SE
- 20 Lovell Rd SE
- 0 Lovell Rd SE Unit 8319641
- 0 Lovell Rd SE
- 0 Lovell Rd SE Unit 9069711
- 0 Lovell Rd SE Unit 8772417
- 0 Lovell Rd SE Unit 7052163
- 0 Lovell Rd SE Unit 7140802
- 0 Lovell Rd SE Unit 8034996
- 0 Lovell Rd SE Unit 8084835
- 0 Lovell Rd SE Unit 8267983