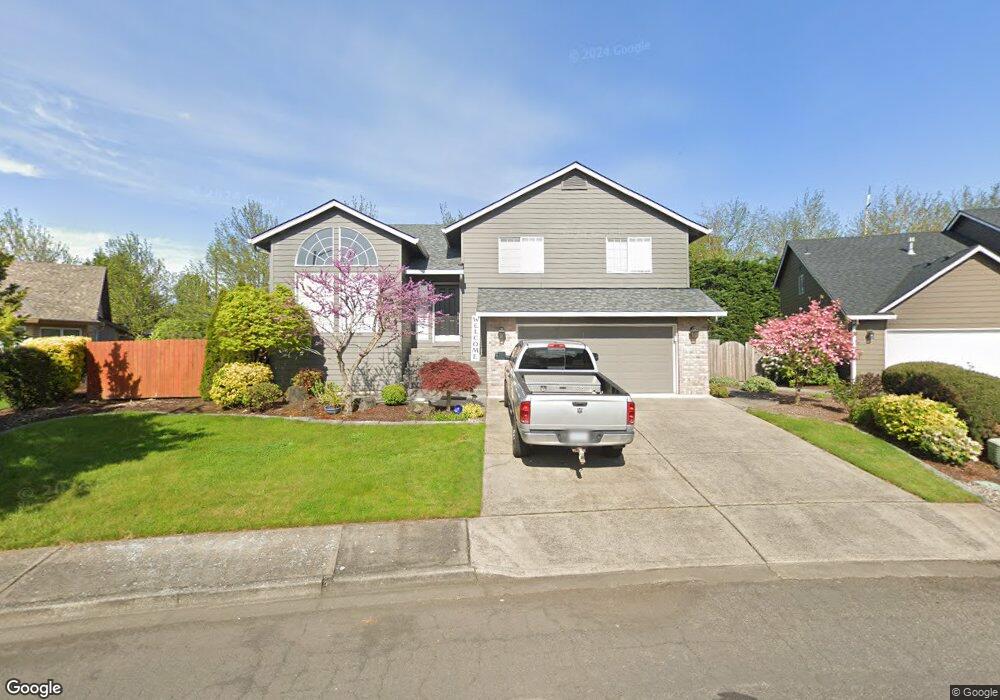
3208 NW 113th Cir Vancouver, WA 98685
Estimated Value: $573,000 - $594,000
3
Beds
3
Baths
2,030
Sq Ft
$289/Sq Ft
Est. Value
About This Home
This home is located at 3208 NW 113th Cir, Vancouver, WA 98685 and is currently estimated at $585,776, approximately $288 per square foot. 3208 NW 113th Cir is a home located in Clark County with nearby schools including Felida Elementary School, Jefferson Middle School, and Skyview High School.
Ownership History
Date
Name
Owned For
Owner Type
Purchase Details
Closed on
Aug 12, 2009
Sold by
Moore Mary B
Bought by
Yackley Debra A
Current Estimated Value
Home Financials for this Owner
Home Financials are based on the most recent Mortgage that was taken out on this home.
Original Mortgage
$249,850
Outstanding Balance
$163,650
Interest Rate
5.3%
Mortgage Type
Purchase Money Mortgage
Estimated Equity
$422,126
Purchase Details
Closed on
Aug 20, 1996
Sold by
Donahue Frank E
Bought by
Moore Mary B
Home Financials for this Owner
Home Financials are based on the most recent Mortgage that was taken out on this home.
Original Mortgage
$125,000
Interest Rate
8.42%
Mortgage Type
Balloon
Purchase Details
Closed on
Mar 15, 1996
Sold by
Donahue Lorrie L
Bought by
Donahue Frank E
Home Financials for this Owner
Home Financials are based on the most recent Mortgage that was taken out on this home.
Original Mortgage
$140,000
Interest Rate
10.25%
Create a Home Valuation Report for This Property
The Home Valuation Report is an in-depth analysis detailing your home's value as well as a comparison with similar homes in the area
Home Values in the Area
Average Home Value in this Area
Purchase History
| Date | Buyer | Sale Price | Title Company |
|---|---|---|---|
| Yackley Debra A | $263,000 | Stewart Title | |
| Moore Mary B | $175,000 | Chicago Title Insurance Co | |
| Donahue Frank E | -- | First American Title Co | |
| Donahue Frank E | $41,000 | First American Title Ins Co |
Source: Public Records
Mortgage History
| Date | Status | Borrower | Loan Amount |
|---|---|---|---|
| Open | Yackley Debra A | $249,850 | |
| Previous Owner | Moore Mary B | $125,000 | |
| Previous Owner | Donahue Frank E | $140,000 |
Source: Public Records
Tax History Compared to Growth
Tax History
| Year | Tax Paid | Tax Assessment Tax Assessment Total Assessment is a certain percentage of the fair market value that is determined by local assessors to be the total taxable value of land and additions on the property. | Land | Improvement |
|---|---|---|---|---|
| 2025 | $5,349 | $543,596 | $200,760 | $342,836 |
| 2024 | $5,017 | $506,484 | $200,760 | $305,724 |
| 2023 | $5,300 | $555,316 | $224,888 | $330,428 |
| 2022 | $4,818 | $538,803 | $224,888 | $313,915 |
| 2021 | $4,495 | $435,966 | $158,000 | $277,966 |
| 2020 | $4,126 | $381,422 | $142,250 | $239,172 |
| 2019 | $3,817 | $371,963 | $142,250 | $229,713 |
| 2018 | $4,270 | $356,982 | $0 | $0 |
| 2017 | $3,827 | $333,358 | $0 | $0 |
| 2016 | $3,718 | $311,113 | $0 | $0 |
| 2015 | $3,636 | $282,640 | $0 | $0 |
| 2014 | -- | $266,791 | $0 | $0 |
| 2013 | -- | $245,069 | $0 | $0 |
Source: Public Records
Map
Nearby Homes
- 10916 NW 33rd Ave
- 11419 NW 34th Ct
- 11510 NW 29th Place
- 3312 NW 116th Way
- 3602 NW 107th St
- 11604 NW 35th Ave
- 11507 NW 27th Ave
- 11115 NW 38th Ave
- 10712 NW 30th Ct
- 10515 NW 32nd Dr
- 11801 NW 26th Ave
- 3515 NW 122nd St
- 1922 NW 112th Cir
- 2809 NW 100th St
- 10215 NW 24th Ave
- 1905 NW 110th Cir
- 12510 NW 34th Ct
- 12104 NW 20th Ave
- 2500 NW 100th St
- 11111 NW 19th Ave
- 3212 NW 113th Cir
- 3204 NW 113th Cir
- 3200 NW 113th Cir
- 3300 NW 113th Cir
- 3301 NW 113th Cir
- 3201 NW 113th Cir
- 11312 NW 31st Ave
- 3205 NW 113th Cir
- 3304 NW 113th Cir
- 3011 NW 113th St
- 3307 NW 113th Cir
- 3306 NW 113th Cir
- 3012 NW 113th St
- 11316 NW 31st Ave
- 11114 NW Lakeshore Ave
- 3014 NW 112th St
- 3302 NW 112th St
- 11113 NW 33rd Ave
- 3311 NW 113th Cir
- 3005 NW 113th St