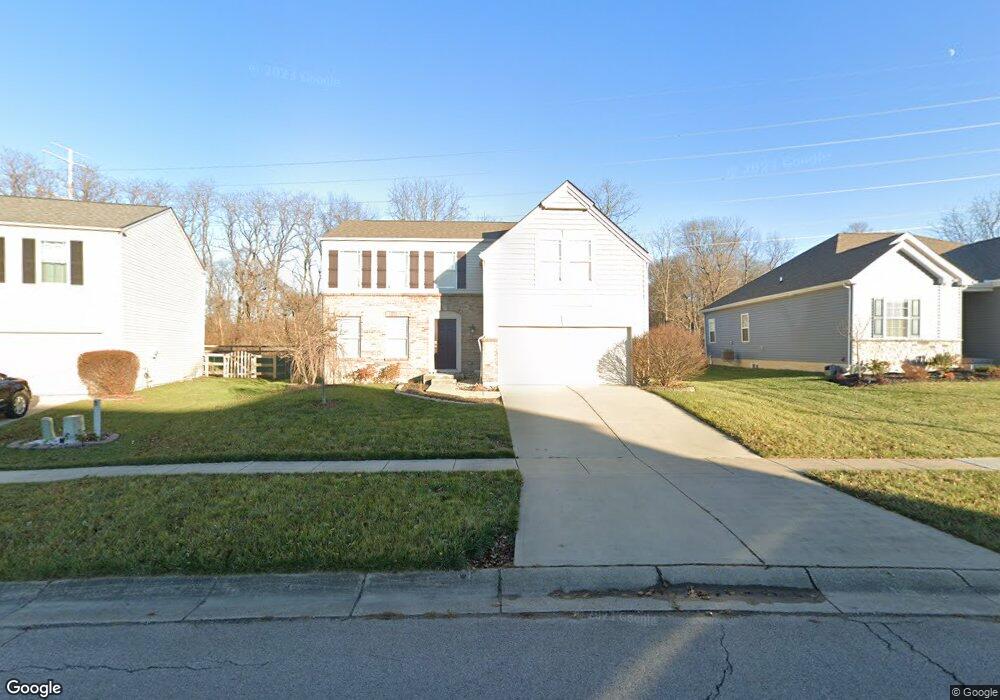
3208 Shadow Ridge Ct Morrow, OH 45152
Estimated Value: $359,000 - $396,000
3
Beds
3
Baths
2,088
Sq Ft
$181/Sq Ft
Est. Value
About This Home
This home is located at 3208 Shadow Ridge Ct, Morrow, OH 45152 and is currently estimated at $378,350, approximately $181 per square foot. 3208 Shadow Ridge Ct is a home located in Warren County with nearby schools including Little Miami Early Childhood Center, Little Miami Intermediate Middle School, and Little Miami Middle School.
Ownership History
Date
Name
Owned For
Owner Type
Purchase Details
Closed on
Jul 6, 2010
Sold by
Federal Home Loan Mortgage Corporation
Bought by
Schulte Michael and Schulte Crystal
Current Estimated Value
Home Financials for this Owner
Home Financials are based on the most recent Mortgage that was taken out on this home.
Original Mortgage
$128,272
Interest Rate
4.58%
Mortgage Type
FHA
Purchase Details
Closed on
Apr 12, 2010
Sold by
Porterfield Justin Bishop
Bought by
Federal Home Loan Mortgage Corp
Purchase Details
Closed on
Nov 13, 2006
Sold by
Maple Street Homes Llc
Bought by
Porterfield Justin Bishop and Porterfield Sarah Denise
Home Financials for this Owner
Home Financials are based on the most recent Mortgage that was taken out on this home.
Original Mortgage
$199,651
Interest Rate
6.47%
Mortgage Type
Unknown
Purchase Details
Closed on
Aug 24, 2006
Sold by
Hopewell Valley Development Llc
Bought by
Maple Street Homes Llc
Create a Home Valuation Report for This Property
The Home Valuation Report is an in-depth analysis detailing your home's value as well as a comparison with similar homes in the area
Home Values in the Area
Average Home Value in this Area
Purchase History
| Date | Buyer | Sale Price | Title Company |
|---|---|---|---|
| Schulte Michael | $130,000 | Attorney | |
| Federal Home Loan Mortgage Corp | $120,000 | None Available | |
| Porterfield Justin Bishop | $199,666 | Homestead Title | |
| Maple Street Homes Llc | $86,800 | Homestead Title |
Source: Public Records
Mortgage History
| Date | Status | Borrower | Loan Amount |
|---|---|---|---|
| Previous Owner | Schulte Michael | $128,272 | |
| Previous Owner | Porterfield Justin Bishop | $199,651 |
Source: Public Records
Tax History
| Year | Tax Paid | Tax Assessment Tax Assessment Total Assessment is a certain percentage of the fair market value that is determined by local assessors to be the total taxable value of land and additions on the property. | Land | Improvement |
|---|---|---|---|---|
| 2025 | $4,482 | $99,750 | $28,000 | $71,750 |
| 2024 | $4,482 | $99,750 | $28,000 | $71,750 |
| 2023 | $3,747 | $74,266 | $15,820 | $58,446 |
| 2022 | $3,703 | $74,267 | $15,820 | $58,447 |
| 2021 | $3,528 | $74,267 | $15,820 | $58,447 |
| 2020 | $3,703 | $65,723 | $14,000 | $51,723 |
| 2019 | $3,781 | $65,723 | $14,000 | $51,723 |
| 2018 | $3,580 | $65,723 | $14,000 | $51,723 |
| 2017 | $2,999 | $52,955 | $11,459 | $41,496 |
| 2016 | $3,078 | $52,955 | $11,459 | $41,496 |
| 2015 | $3,071 | $52,955 | $11,459 | $41,496 |
| 2014 | $3,240 | $49,490 | $10,710 | $38,780 |
| 2013 | $3,056 | $64,690 | $14,000 | $50,690 |
Source: Public Records
Map
Nearby Homes
- 5441 Hopewell Valley Dr
- 3031 Yellowtail Terrace
- 114 Highlawn Ave
- 6407 Cooper Grace Ln
- 5194 Lucy James Ct
- 6490 Cooper Grace Ln
- 5609 Shetland Ct
- 2719 Aristides Ct
- 5224 Man o War Dr
- 2661 Unbridled Way
- 5817 Montrose Ct
- 480 Charismatic Ct
- 5976 Outlook Ct
- 2311 Sir Barton Dr
- 3155 Rosemary Ct Unit Lot 94
- 3155 Rosemary Ct
- 4836 Jessica Suzanne Dr
- 5750 Azra Ct
- 6017 Outlook Ct
- Birch with Included Basement Plan at Woodlands at Morrow
- 3214 Shadow Ridge Ct
- 3202 Shadow Ridge Ct
- 3220 Shadow Ridge Ct
- 3196 Shadow Ridge Ct
- 3205 Shadow Ridge Ct
- 3190 Shadow Rdg Ct
- 3213 Shadow Ridge Ct
- 3226 Shadow Ridge Ct
- 3190 Shadow Ridge Ct
- 3189 Shadow Ridge Ct
- 3219 Shadow Ridge Ct
- 3184 Shadow Ridge Ct
- 3232 Shadow Ridge Ct
- 3227 Shadow Ridge Ct
- 5270 Valley View Dr
- 5270 Valley View Dr Unit 83
- 3178 Shadow Ridge Ct
- 3235 Shadow Ridge Ct
- 3238 Shadow Ridge Ct
- 5292 Valley View Dr