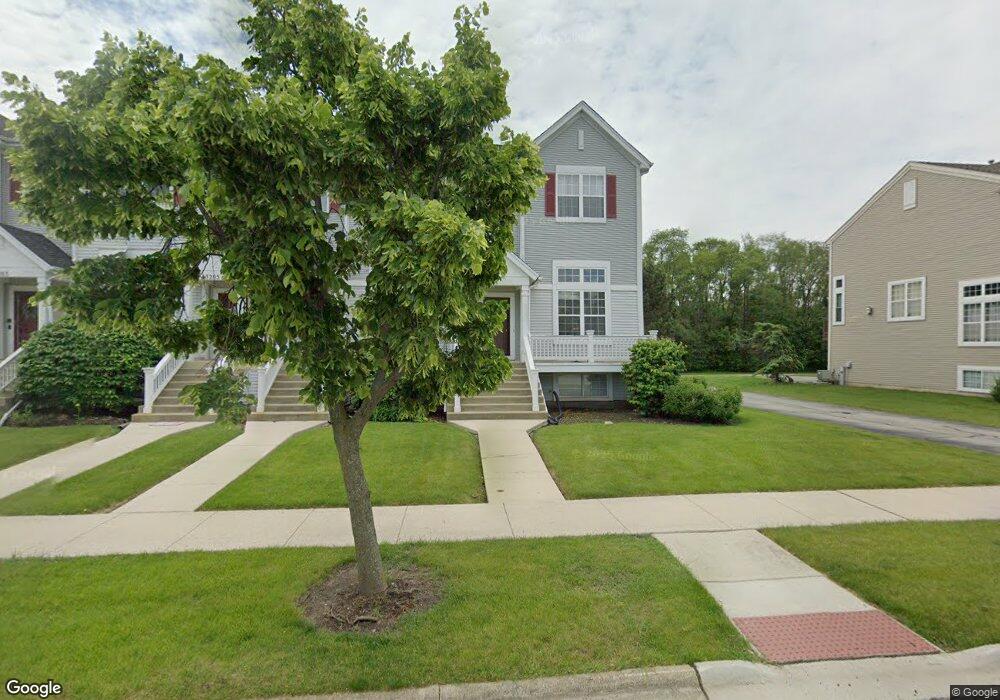
3209 Holden Cir Unit 1285 Matteson, IL 60443
Old Matteson NeighborhoodEstimated Value: $195,000 - $235,000
--
Bed
--
Bath
144,000
Sq Ft
$1/Sq Ft
Est. Value
About This Home
This home is located at 3209 Holden Cir Unit 1285, Matteson, IL 60443 and is currently estimated at $211,690, approximately $1 per square foot. 3209 Holden Cir Unit 1285 is a home located in Cook County with nearby schools including Illinois School, Indiana Elementary School, and Arcadia Elementary School.
Create a Home Valuation Report for This Property
The Home Valuation Report is an in-depth analysis detailing your home's value as well as a comparison with similar homes in the area
Home Values in the Area
Average Home Value in this Area
Tax History Compared to Growth
Tax History
| Year | Tax Paid | Tax Assessment Tax Assessment Total Assessment is a certain percentage of the fair market value that is determined by local assessors to be the total taxable value of land and additions on the property. | Land | Improvement |
|---|---|---|---|---|
| 2024 | $4,410 | $17,466 | $2,686 | $14,780 |
| 2023 | $2,751 | $17,466 | $2,686 | $14,780 |
| 2022 | $2,751 | $12,083 | $1,518 | $10,565 |
| 2021 | $2,890 | $12,083 | $1,518 | $10,565 |
| 2020 | $4,179 | $12,083 | $1,518 | $10,565 |
| 2019 | $2,493 | $8,246 | $1,401 | $6,845 |
| 2018 | $2,045 | $8,246 | $1,401 | $6,845 |
| 2017 | $2,830 | $9,915 | $1,401 | $8,514 |
| 2016 | $2,586 | $7,756 | $1,284 | $6,472 |
| 2015 | $2,045 | $7,756 | $1,284 | $6,472 |
| 2014 | $2,449 | $7,756 | $1,284 | $6,472 |
| 2013 | $3,896 | $11,656 | $1,284 | $10,372 |
Source: Public Records
Map
Nearby Homes
- 3133 Heritage Blvd
- 21635 Dogwood Rd Unit 1165
- 338 Waldmann Dr
- 356 Winnebago St
- 500 Antietam St
- 315 Sheridan St
- 119 Willow St
- 508 Davis St
- 119 Well St
- 136 Willow St
- 109 Walnut St
- 302 Springfield St
- 21607 Main St
- 129 Warwick St
- 116 Walnut St
- 549 Homan Ave
- 206 Westwood Dr
- 300 Indiana St
- 183 Washington St
- 310 New Salem St
- 3205 Holden Cir Unit 1283
- 3203 Holden Cir Unit 1282
- 3207 Holden Cir Unit 1284
- 3201 Holden Cir Unit 1281
- 3211 Holden Cir Unit 1271
- 3213 Holden Cir Unit 1272
- 3215 Holden Cir Unit 1273
- 3217 Holden Cir Unit 1274
- 3217 Holden Cir Unit 1
- 3219 Holden Cir Unit 1275
- 3157 Holden Cir Unit 1296
- 3221 Holden Cir Unit 1276
- 3210 Holden Cir
- 3155 Holden Cir Unit 1295
- 3214 Holden Cir
- 3153 Holden Cir Unit 1294
- 3148 Holden Cir
- 3151 Holden Cir Unit 1293
- 3218 Holden Cir
- 3149 Holden Cir Unit 1292