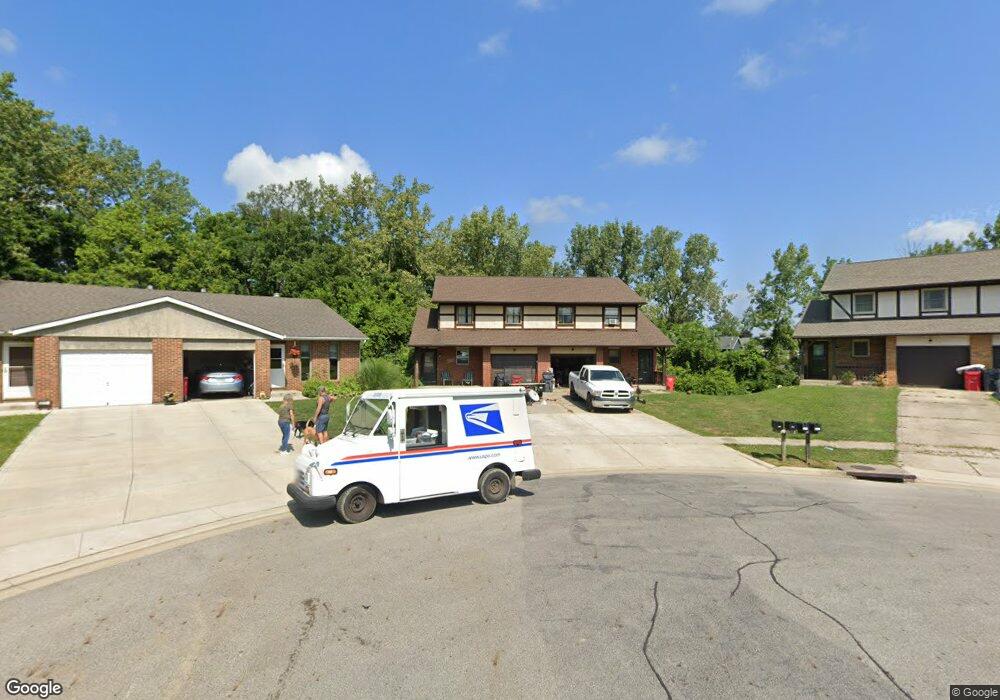
3209 Independence St Unit 211 Grove City, OH 43123
Estimated Value: $303,000 - $375,000
6
Beds
4
Baths
2,512
Sq Ft
$134/Sq Ft
Est. Value
About This Home
This home is located at 3209 Independence St Unit 211, Grove City, OH 43123 and is currently estimated at $336,371, approximately $133 per square foot. 3209 Independence St Unit 211 is a home located in Franklin County with nearby schools including Highland Park Elementary School, Park Street Intermediate School, and Grove City High School.
Ownership History
Date
Name
Owned For
Owner Type
Purchase Details
Closed on
Jan 28, 2025
Sold by
Roach Nicholas B and Roach Olivia N
Bought by
Gba Usa Llc
Current Estimated Value
Purchase Details
Closed on
Dec 13, 2024
Sold by
Berkley J Roach Revocable Trust and Roach Berkley J
Bought by
Roach Nicholas B and Roach Olivia N
Purchase Details
Closed on
Dec 15, 2017
Sold by
Indep Llc and Rauck James G
Bought by
Rauch Berkley J and The Berkley J Rauch Revocabel Trust
Purchase Details
Closed on
Jan 15, 2010
Sold by
Rauck James G and Rauck Allyson B
Bought by
Indeep Llc
Purchase Details
Closed on
Jan 19, 2005
Sold by
Rauck James O and Rauck Patrice A
Bought by
Rauck James G
Purchase Details
Closed on
Nov 19, 2001
Sold by
Rauck Amanda M and Termuhlen Amanda M
Bought by
Rauck James O and Rauck Patrice A
Purchase Details
Closed on
Dec 2, 1993
Bought by
Rauck Amanda M
Purchase Details
Closed on
Aug 1, 1986
Create a Home Valuation Report for This Property
The Home Valuation Report is an in-depth analysis detailing your home's value as well as a comparison with similar homes in the area
Home Values in the Area
Average Home Value in this Area
Purchase History
| Date | Buyer | Sale Price | Title Company |
|---|---|---|---|
| Gba Usa Llc | -- | None Listed On Document | |
| Roach Nicholas B | $300,600 | None Listed On Document | |
| Roach Nicholas B | $300,600 | None Listed On Document | |
| Rauch Berkley J | $135,000 | Valmer Land Title Agency | |
| Indeep Llc | -- | Attorney | |
| Rauck James G | -- | -- | |
| Rauck James O | $115,000 | Chicago Title | |
| Rauck Amanda M | $122,300 | -- | |
| -- | $95,000 | -- |
Source: Public Records
Tax History Compared to Growth
Tax History
| Year | Tax Paid | Tax Assessment Tax Assessment Total Assessment is a certain percentage of the fair market value that is determined by local assessors to be the total taxable value of land and additions on the property. | Land | Improvement |
|---|---|---|---|---|
| 2024 | $7,312 | $105,210 | $22,960 | $82,250 |
| 2023 | $4,830 | $105,210 | $22,960 | $82,250 |
| 2022 | $3,540 | $56,700 | $14,700 | $42,000 |
| 2021 | $3,608 | $56,700 | $14,700 | $42,000 |
| 2020 | $3,598 | $56,700 | $14,700 | $42,000 |
| 2019 | $3,237 | $47,250 | $12,250 | $35,000 |
| 2018 | $3,438 | $47,250 | $12,250 | $35,000 |
| 2017 | $4,459 | $65,490 | $12,250 | $53,240 |
| 2016 | $3,648 | $49,000 | $8,330 | $40,670 |
| 2015 | $3,649 | $49,000 | $8,330 | $40,670 |
| 2014 | $3,652 | $49,000 | $8,330 | $40,670 |
| 2013 | $1,726 | $49,000 | $8,330 | $40,670 |
Source: Public Records
Map
Nearby Homes
- 3267 Castleton St
- 2711-2713 Charles Dr
- 3120-3122 Walden Place
- 3172 Pine Manor Blvd Unit 3172
- 3429 Devin Rd
- 3449 Liberty St
- 2541 Swan Dr
- 2539 Swan Dr Unit 2539
- 3454 Independence St
- 3156 Hoover Rd
- 3474 Highland St
- 3153 Scenic Way
- 3333 Tareyton Dr
- 2571 Scott Ct
- 2545 Scott Ct
- 3466 Central Ave
- 2421 Yates Ave
- 3542 Hoover Rd
- 3201 Parkview Cir
- 3187 Parkview Cir Unit 3187
- 3217 Independence St
- 3204 Independence St Unit 206
- 3215 Independence St
- 3210 Independence St Unit 212
- 2712 Independence Way Unit 716
- 2722 Independence Way Unit 726
- 3218 Independence St
- 3216 Independence St Unit 218
- 3216 3218 Independence
- 2730 Independence Way Unit 734
- 2730 Independence Way Unit 2
- 3226 Independence St Unit 228
- 2717 Walden Bluff Ct Unit 4
- 2697 Walden Bluff Ct Unit 703
- 2697 Walden Bluff Ct
- 3752 Miltonsburg Dr
- 2689 Walden Bluff Ct Unit 691
- 3236 Independence St
- 2739 Walden Bluff Ct
- 2738 Independence Way Unit 742