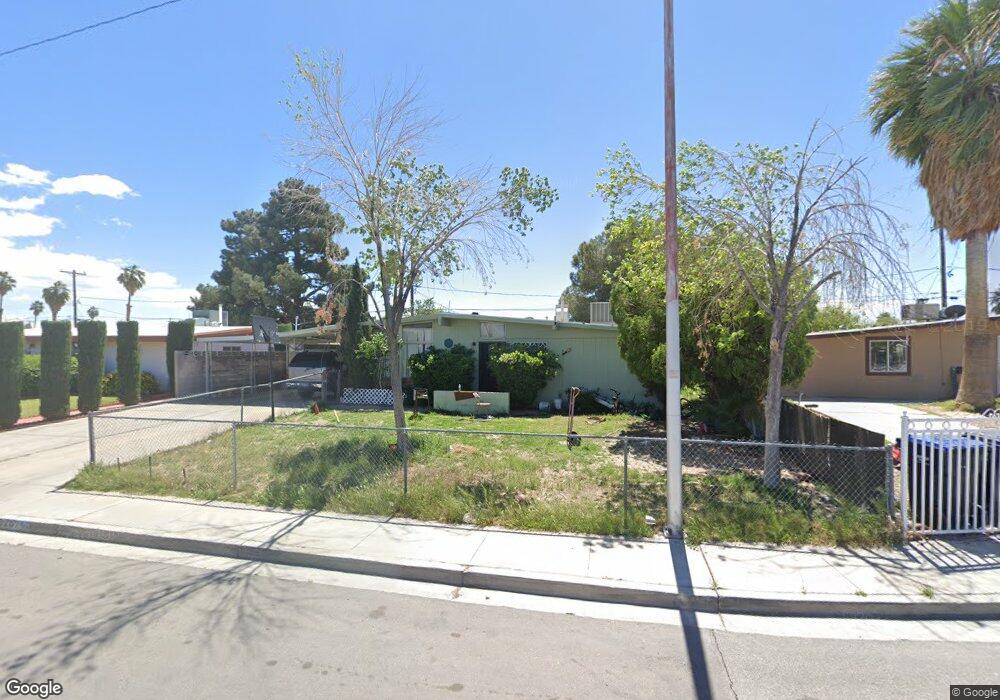
3209 Stanley Ave North Las Vegas, NV 89030
Downtown North Las Vegas NeighborhoodEstimated Value: $303,522 - $339,000
3
Beds
1
Bath
1,124
Sq Ft
$285/Sq Ft
Est. Value
About This Home
This home is located at 3209 Stanley Ave, North Las Vegas, NV 89030 and is currently estimated at $320,131, approximately $284 per square foot. 3209 Stanley Ave is a home located in Clark County with nearby schools including Tom Williams Elementary School, J.D. Smith Middle School, and Desert Pines High School.
Ownership History
Date
Name
Owned For
Owner Type
Purchase Details
Closed on
Jul 31, 2012
Sold by
Liechty Terrance K and Liechty Yvonne Voss
Bought by
K P Property Hildings Llc
Current Estimated Value
Purchase Details
Closed on
Nov 22, 2011
Sold by
Liechty Terrance K
Bought by
Liechty Terrance K and Voss Liechty Yvonne
Purchase Details
Closed on
Jan 25, 2008
Sold by
Liechty Beulah P and Liechty Terrance K
Bought by
The Beulah Liechty Trust
Purchase Details
Closed on
Mar 20, 2002
Sold by
Liechty Beulah P
Bought by
Liechty Beulah P and Liechty Devalin
Create a Home Valuation Report for This Property
The Home Valuation Report is an in-depth analysis detailing your home's value as well as a comparison with similar homes in the area
Home Values in the Area
Average Home Value in this Area
Purchase History
| Date | Buyer | Sale Price | Title Company |
|---|---|---|---|
| K P Property Hildings Llc | -- | None Available | |
| Liechty Terrance K | -- | None Available | |
| The Beulah Liechty Trust | -- | None Available | |
| Liechty Beulah P | -- | -- |
Source: Public Records
Tax History Compared to Growth
Tax History
| Year | Tax Paid | Tax Assessment Tax Assessment Total Assessment is a certain percentage of the fair market value that is determined by local assessors to be the total taxable value of land and additions on the property. | Land | Improvement |
|---|---|---|---|---|
| 2025 | $586 | $41,248 | $24,150 | $17,098 |
| 2024 | $586 | $41,248 | $24,150 | $17,098 |
| 2023 | $614 | $41,304 | $25,900 | $15,404 |
| 2022 | $596 | $35,567 | $21,700 | $13,867 |
| 2021 | $552 | $33,159 | $20,300 | $12,859 |
| 2020 | $552 | $31,752 | $19,250 | $12,502 |
| 2019 | $527 | $27,814 | $15,750 | $12,064 |
| 2018 | $503 | $23,941 | $12,600 | $11,341 |
| 2017 | $735 | $21,902 | $10,500 | $11,402 |
| 2016 | $477 | $18,059 | $7,000 | $11,059 |
| 2015 | $475 | $16,336 | $5,600 | $10,736 |
| 2014 | $460 | $14,439 | $4,200 | $10,239 |
Source: Public Records
Map
Nearby Homes
- 3200 E Owens Ave
- 1620 Kenneth St
- 3600 Reynolds Ave
- 3601 E Webb Ave
- 2746 E Owens Ave
- 3205 Mary Ann Ave
- 1413 N Mojave Rd
- 2844 Hickey Ave
- 1304 Melissa St
- 3308 E Lake Mead Blvd
- 1311 Flower Ave
- 3204 Osage Ave
- 2801 Emmons Ave
- 3212 Osage Ave
- 1830 N Pecos Rd Unit 230
- 1830 N Pecos Rd Unit 137
- 3320 Osage Ave
- 3601 Thomas Ave
- 2932 Demetrius Ave
- 3308 Tabor Ave
- 3215 Stanley Ave
- 3200 E Webb Ave
- 3116 E Webb Ave
- 3204 E Webb Ave
- 3219 Stanley Ave
- 3201 Stanley Ave
- 3112 E Webb Ave
- 3208 E Webb Ave
- 3212 Stanley Ave
- 3223 Stanley Ave
- 3220 Stanley Ave
- 1625 Ingraham St
- 3108 E Webb Ave
- 3212 E Webb Ave
- 1629 Ingraham St
- 3224 Stanley Ave
- 3301 Stanley Ave
- 1638 Ingraham St
- 3300 E Webb Ave
- 3201 E Webb Ave