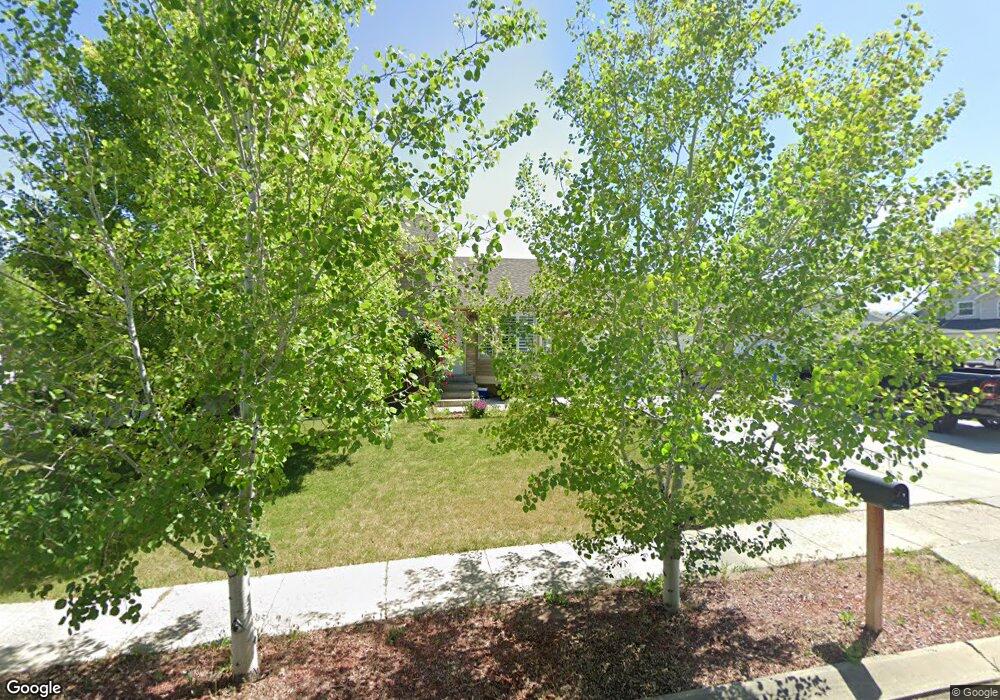
3209 W 8525 S West Jordan, UT 84088
Estimated Value: $523,000 - $572,000
5
Beds
4
Baths
2,037
Sq Ft
$273/Sq Ft
Est. Value
About This Home
This home is located at 3209 W 8525 S, West Jordan, UT 84088 and is currently estimated at $555,176, approximately $272 per square foot. 3209 W 8525 S is a home located in Salt Lake County with nearby schools including Terra Linda Elementary School, Joel P. Jensen Middle School, and West Jordan High School.
Ownership History
Date
Name
Owned For
Owner Type
Purchase Details
Closed on
Nov 15, 2021
Sold by
Brinkerhoff Riley D and Brinkerhoff Ashley
Bought by
Garcia German R
Current Estimated Value
Home Financials for this Owner
Home Financials are based on the most recent Mortgage that was taken out on this home.
Original Mortgage
$420,000
Outstanding Balance
$385,389
Interest Rate
3.09%
Mortgage Type
New Conventional
Estimated Equity
$169,787
Purchase Details
Closed on
Apr 2, 2020
Sold by
Brinkerhoff Riley D and Brinkerhoff Ashley M
Bought by
Brinkerhoff Riley D and Brinkerhoff Ashley
Home Financials for this Owner
Home Financials are based on the most recent Mortgage that was taken out on this home.
Original Mortgage
$299,600
Interest Rate
3.4%
Mortgage Type
New Conventional
Purchase Details
Closed on
Mar 12, 2018
Sold by
Gibbons Robert T and Gibbons Lisa V
Bought by
Brinkerhoff Riley D and Brinkerhoff Ashley M
Home Financials for this Owner
Home Financials are based on the most recent Mortgage that was taken out on this home.
Original Mortgage
$300,200
Interest Rate
4.15%
Mortgage Type
New Conventional
Purchase Details
Closed on
Nov 2, 2009
Sold by
Mortgage Guaranty Insurance Corporation
Bought by
Gibbons Robert T and Gibbons Lisa
Home Financials for this Owner
Home Financials are based on the most recent Mortgage that was taken out on this home.
Original Mortgage
$186,558
Interest Rate
4.99%
Mortgage Type
FHA
Purchase Details
Closed on
Oct 6, 2009
Sold by
Federal National Mortgage Association
Bought by
Mortgage Guaranty Insurance Corporation
Home Financials for this Owner
Home Financials are based on the most recent Mortgage that was taken out on this home.
Original Mortgage
$186,558
Interest Rate
4.99%
Mortgage Type
FHA
Purchase Details
Closed on
Jul 22, 2009
Sold by
Tang Tan
Bought by
Federal National Mortgage Association
Purchase Details
Closed on
Aug 17, 2001
Sold by
Tang Minh Hien and Tang Minh H
Bought by
Tang Tan
Home Financials for this Owner
Home Financials are based on the most recent Mortgage that was taken out on this home.
Original Mortgage
$155,200
Interest Rate
7.19%
Purchase Details
Closed on
Oct 5, 2000
Sold by
Ho Dung Thi
Bought by
Tang Minh Hien
Purchase Details
Closed on
Jul 17, 1997
Sold by
Williams David L and Williams Tara W
Bought by
Tang Minh H and Ho Dung
Home Financials for this Owner
Home Financials are based on the most recent Mortgage that was taken out on this home.
Original Mortgage
$126,500
Interest Rate
7.83%
Create a Home Valuation Report for This Property
The Home Valuation Report is an in-depth analysis detailing your home's value as well as a comparison with similar homes in the area
Home Values in the Area
Average Home Value in this Area
Purchase History
| Date | Buyer | Sale Price | Title Company |
|---|---|---|---|
| Garcia German R | -- | Truly Title Inc | |
| Brinkerhoff Riley D | -- | Northern Title Co | |
| Brinkerhoff Riley D | -- | Title One | |
| Gibbons Robert T | $190,000 | Founders Title | |
| Mortgage Guaranty Insurance Corporation | -- | Founders Title | |
| Federal National Mortgage Association | $122,098 | Backman Title Services | |
| Tang Tan | -- | Backman Stewart Title Servic | |
| Tang Minh Hien | -- | -- | |
| Tang Minh H | -- | -- |
Source: Public Records
Mortgage History
| Date | Status | Borrower | Loan Amount |
|---|---|---|---|
| Open | Garcia German R | $420,000 | |
| Previous Owner | Brinkerhoff Riley D | $299,600 | |
| Previous Owner | Brinkerhoff Riley D | $300,200 | |
| Previous Owner | Gibbons Robert T | $186,558 | |
| Previous Owner | Tang Tan | $155,200 | |
| Previous Owner | Tang Minh H | $126,500 |
Source: Public Records
Tax History Compared to Growth
Tax History
| Year | Tax Paid | Tax Assessment Tax Assessment Total Assessment is a certain percentage of the fair market value that is determined by local assessors to be the total taxable value of land and additions on the property. | Land | Improvement |
|---|---|---|---|---|
| 2025 | $2,709 | $538,400 | $126,100 | $412,300 |
| 2024 | $2,709 | $521,300 | $122,000 | $399,300 |
| 2023 | $2,592 | $470,000 | $109,100 | $360,900 |
| 2022 | $2,682 | $478,500 | $106,900 | $371,600 |
| 2021 | $2,119 | $344,100 | $84,600 | $259,500 |
| 2020 | $2,020 | $307,900 | $84,600 | $223,300 |
| 2019 | $2,030 | $303,400 | $84,600 | $218,800 |
| 2018 | $1,837 | $272,300 | $81,600 | $190,700 |
| 2017 | $1,728 | $255,000 | $81,600 | $173,400 |
| 2016 | $1,648 | $228,500 | $85,900 | $142,600 |
| 2015 | $1,640 | $221,700 | $87,600 | $134,100 |
| 2014 | $1,575 | $209,600 | $83,500 | $126,100 |
Source: Public Records
Map
Nearby Homes
- 8493 S 3200 W
- 3112 Green Acre Dr
- 8407 Meadow Green Way
- 3214 W Monterey Pine Ln
- 2970 W 8870 S
- 8180 S Old Bingham Hwy
- 4000 W 8400 S Unit 83
- 8461 S Meadowlark Ln
- 3332 Lower Newark Way
- 8058 S Lismore Ln Unit 304
- 8886 S 2700 W
- 7987 S 2980 W
- 3827 W Country Squire Dr
- 7993 S 2760 W
- 3066 W Linton Dr
- 3546 W 7980 S
- 7968 S 2700 W
- 7942 S 2800 W
- 3476 W Spaulding Rd
- 8461 S 2385 W
- 8537 S 3220 W
- 8526 S 3220 W
- 3185 W 8525 S
- 8519 S 3220 W
- 8526 Huckleberry Cir
- 8528 S 3220 W
- 8538 S 3220 W
- 8557 S 3220 W
- 8514 S 3260 W
- 3196 W 8565 S
- 8514 Huckleberry Cir
- 8514 S 3220 W
- 3183 W 8525 S
- 3190 W 8525 S
- 8554 S 3220 W
- 3194 W 8565 S
- 3169 W 8525 S
- 3188 W 8525 S
- 3216 W 8510 S
- 8523 Huckleberry Cir