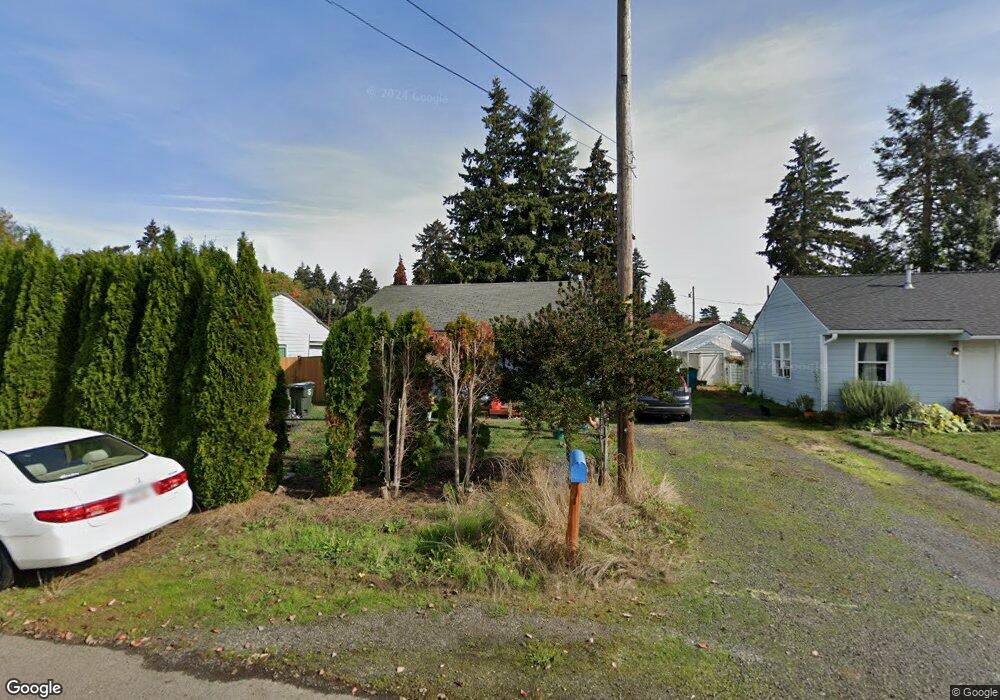
3209 Yeoman Ave Vancouver, WA 98660
Fruit Valley NeighborhoodEstimated Value: $383,000 - $393,000
2
Beds
1
Bath
816
Sq Ft
$475/Sq Ft
Est. Value
About This Home
This home is located at 3209 Yeoman Ave, Vancouver, WA 98660 and is currently estimated at $387,883, approximately $475 per square foot. 3209 Yeoman Ave is a home located in Clark County with nearby schools including Fruit Valley Elementary School, Discovery Middle School, and Hudson's Bay High School.
Ownership History
Date
Name
Owned For
Owner Type
Purchase Details
Closed on
Oct 13, 2014
Sold by
Brown Marcus W
Bought by
Cheely Jessica
Current Estimated Value
Home Financials for this Owner
Home Financials are based on the most recent Mortgage that was taken out on this home.
Original Mortgage
$133,536
Outstanding Balance
$104,765
Interest Rate
4.75%
Mortgage Type
FHA
Estimated Equity
$283,118
Purchase Details
Closed on
Mar 26, 2007
Sold by
Wilson Jason B and Day Rebekah E
Bought by
Brown Marcus W
Home Financials for this Owner
Home Financials are based on the most recent Mortgage that was taken out on this home.
Original Mortgage
$95,613
Interest Rate
6.2%
Mortgage Type
FHA
Purchase Details
Closed on
Jan 20, 2005
Sold by
The Arden Family Lp
Bought by
Wilson Jason B
Home Financials for this Owner
Home Financials are based on the most recent Mortgage that was taken out on this home.
Original Mortgage
$119,515
Interest Rate
5.12%
Mortgage Type
VA
Purchase Details
Closed on
Apr 13, 1998
Sold by
Arden Carl H
Bought by
Arden Carl H and Arden Teresa B
Purchase Details
Closed on
Aug 26, 1997
Sold by
Arden Carl H and Arden Teresa B
Bought by
Arden Carl H
Create a Home Valuation Report for This Property
The Home Valuation Report is an in-depth analysis detailing your home's value as well as a comparison with similar homes in the area
Home Values in the Area
Average Home Value in this Area
Purchase History
| Date | Buyer | Sale Price | Title Company |
|---|---|---|---|
| Cheely Jessica | $135,719 | Fidelity National Title | |
| Brown Marcus W | $157,000 | Cascade Title | |
| Wilson Jason B | $117,000 | Cascade Title | |
| Arden Carl H | -- | -- | |
| Arden Family Ltd Partnership | -- | -- | |
| Arden Carl H | -- | -- |
Source: Public Records
Mortgage History
| Date | Status | Borrower | Loan Amount |
|---|---|---|---|
| Open | Cheely Jessica | $133,536 | |
| Previous Owner | Brown Marcus W | $95,613 | |
| Previous Owner | Wilson Jason B | $119,515 |
Source: Public Records
Tax History Compared to Growth
Tax History
| Year | Tax Paid | Tax Assessment Tax Assessment Total Assessment is a certain percentage of the fair market value that is determined by local assessors to be the total taxable value of land and additions on the property. | Land | Improvement |
|---|---|---|---|---|
| 2025 | $3,180 | $321,545 | $162,380 | $159,165 |
| 2024 | $3,120 | $325,309 | $162,380 | $162,929 |
| 2023 | $3,081 | $336,049 | $167,980 | $168,069 |
| 2022 | $2,845 | $330,415 | $162,380 | $168,035 |
| 2021 | $2,821 | $284,205 | $139,983 | $144,222 |
| 2020 | $2,495 | $265,716 | $135,958 | $129,758 |
| 2019 | $2,345 | $243,467 | $115,564 | $127,903 |
| 2018 | $2,235 | $237,085 | $0 | $0 |
| 2017 | $1,884 | $187,552 | $0 | $0 |
| 2016 | $1,785 | $164,993 | $0 | $0 |
| 2015 | $1,406 | $149,382 | $0 | $0 |
| 2014 | -- | $111,135 | $0 | $0 |
| 2013 | -- | $92,779 | $0 | $0 |
Source: Public Records
Map
Nearby Homes
- 3403 Xavier Ave
- 2807 van Allman Ave
- 2709 Weigel Ave
- 1911 W 37th St
- 3600 Thompson Ave
- 3711 Thompson Ave
- 2216 Thompson Ave
- 1115 W 33rd Way
- 1106 W 30th St
- 3811 Rose Ct
- 3815 Rose Ct
- 2413 Markle Ave
- 708 W Fourth Plain Blvd
- 709 W Fourth Plain Blvd
- 1014 NW 45th St
- 2100 Kauffman Ave
- 2117 Kauffman Ave
- 1204 W Mcloughlin Blvd
- 615 W 39th St
- 501 W 30th St
- 3207 Yeoman Ave
- 3211 Yeoman Ave
- 0 Yeoman Ave
- 0 Yeoman Ave
- 3303 Yeoman Ave
- 3208 Xavier Ave
- 3205 Yeoman Ave
- 3204 Xavier Ave
- 3210 Xavier Ave
- 3302 Xavier Ave
- 3203 Yeoman Ave
- 3202 Xavier Ave
- 3210 Yeoman Ave
- 3208 Yeoman Ave
- 3204 Yeoman Ave
- 3302 Yeoman Ave
- 3304 Xavier Ave
- 3116 Xavier Ave
- 3115 Yeoman Ave
- 3202 Yeoman Ave