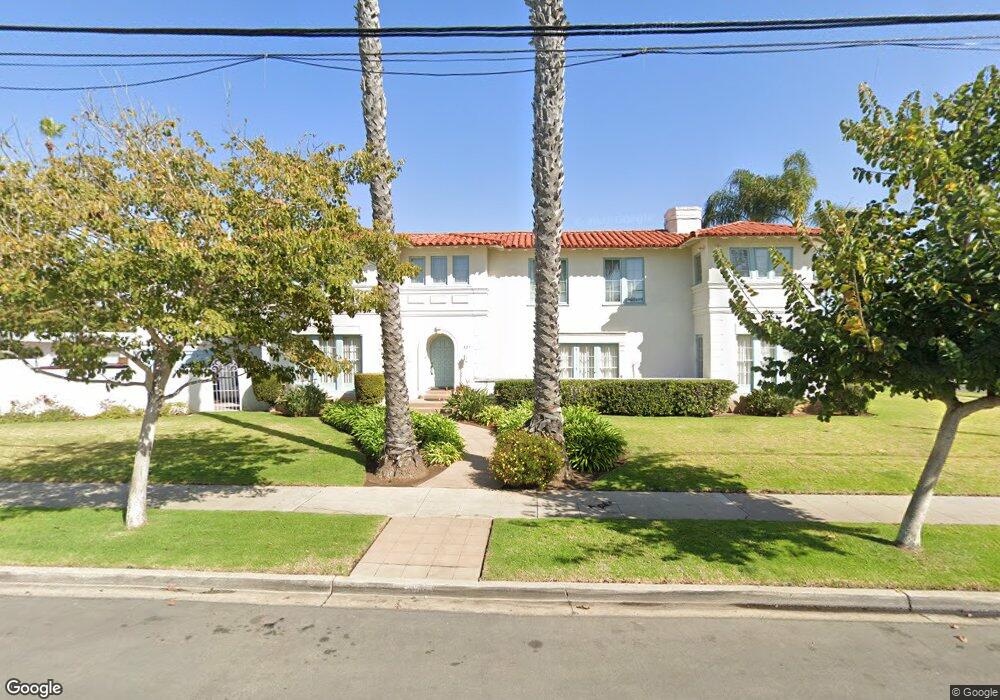
321 10th St Coronado, CA 92118
Estimated Value: $4,854,000 - $6,335,135
6
Beds
5
Baths
4,314
Sq Ft
$1,374/Sq Ft
Est. Value
About This Home
This home is located at 321 10th St, Coronado, CA 92118 and is currently estimated at $5,926,034, approximately $1,373 per square foot. 321 10th St is a home located in San Diego County with nearby schools including Coronado Village Elementary, Coronado Middle School, and Coronado High School.
Ownership History
Date
Name
Owned For
Owner Type
Purchase Details
Closed on
Aug 31, 2021
Sold by
Mountain Ranch Trust and Celestial Trust
Bought by
La Reina Madre Llc
Current Estimated Value
Purchase Details
Closed on
Dec 31, 2020
Sold by
Mountain Ranch Trust and Oder Robert L
Bought by
Celestial Trust and Oder
Purchase Details
Closed on
Apr 11, 2012
Sold by
Oder Robert L
Bought by
Oder Robert L and Oder Monica S
Purchase Details
Closed on
Mar 16, 2011
Sold by
Oder Helon M
Bought by
Oder Helon M
Create a Home Valuation Report for This Property
The Home Valuation Report is an in-depth analysis detailing your home's value as well as a comparison with similar homes in the area
Home Values in the Area
Average Home Value in this Area
Purchase History
| Date | Buyer | Sale Price | Title Company |
|---|---|---|---|
| La Reina Madre Llc | -- | None Listed On Document | |
| Celestial Trust | -- | None Listed On Document | |
| Oder Robert L | -- | None Available | |
| Oder Robert L | -- | None Available | |
| Oder Helon M | -- | None Available | |
| Oder Helon M | -- | None Available |
Source: Public Records
Tax History
| Year | Tax Paid | Tax Assessment Tax Assessment Total Assessment is a certain percentage of the fair market value that is determined by local assessors to be the total taxable value of land and additions on the property. | Land | Improvement |
|---|---|---|---|---|
| 2025 | $7,141 | $570,490 | $177,875 | $392,615 |
| 2024 | $7,141 | $559,305 | $174,388 | $384,917 |
| 2023 | $7,044 | $548,339 | $170,969 | $377,370 |
| 2022 | $6,930 | $537,588 | $167,617 | $369,971 |
| 2021 | $6,843 | $527,048 | $164,331 | $362,717 |
| 2020 | $6,682 | $521,644 | $162,646 | $358,998 |
| 2019 | $6,663 | $511,416 | $159,457 | $351,959 |
| 2018 | $6,568 | $501,389 | $156,331 | $345,058 |
| 2017 | $6,398 | $491,559 | $153,266 | $338,293 |
| 2016 | $6,161 | $481,921 | $150,261 | $331,660 |
| 2015 | $6,008 | $474,683 | $148,004 | $326,679 |
| 2014 | $5,804 | $465,385 | $145,105 | $320,280 |
Source: Public Records
Map
Nearby Homes
- 920 Country Club Ln
- 1100 Pine St
- 120 Carob Way
- 812 H Ave
- 1027 G Ave
- 909 Olive Ave
- 740 Coronado Ave
- 816 F Ave
- 763 G Ave
- 811 10th St
- 848 E Ave Unit L2
- 835 E Ave Unit B
- 911 9th St
- 1058 Isabella Ave
- 1074 Isabella Ave
- 1054 Isabella Ave Unit 58
- 1060 Isabella Ave
- 1056 Isabella Ave
- 933 D Ave
- 835 D Ave Unit 5
Your Personal Tour Guide
Ask me questions while you tour the home.