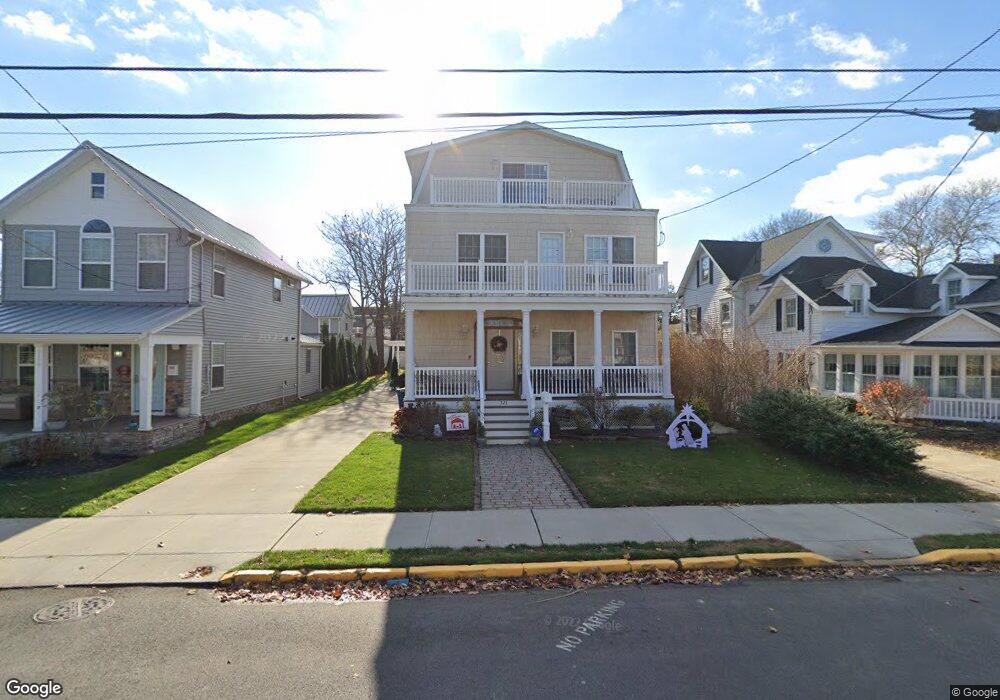
321 12th Ave Belmar, NJ 07719
Estimated Value: $1,683,000 - $2,544,000
5
Beds
2
Baths
4,004
Sq Ft
$512/Sq Ft
Est. Value
About This Home
This home is located at 321 12th Ave, Belmar, NJ 07719 and is currently estimated at $2,049,092, approximately $511 per square foot. 321 12th Ave is a home located in Monmouth County with nearby schools including Belmar Elementary School, St. Rose Grammar School, and St Rose High School.
Ownership History
Date
Name
Owned For
Owner Type
Purchase Details
Closed on
Oct 17, 2024
Sold by
Garley Sheila G
Bought by
Garley Sheila G
Current Estimated Value
Purchase Details
Closed on
Sep 1, 2020
Sold by
Garley James T
Bought by
Garley James T and Garley Sheila G
Purchase Details
Closed on
Feb 24, 2000
Sold by
Wheeler Kenneth
Bought by
Garley James
Home Financials for this Owner
Home Financials are based on the most recent Mortgage that was taken out on this home.
Original Mortgage
$112,800
Interest Rate
8.21%
Create a Home Valuation Report for This Property
The Home Valuation Report is an in-depth analysis detailing your home's value as well as a comparison with similar homes in the area
Home Values in the Area
Average Home Value in this Area
Purchase History
| Date | Buyer | Sale Price | Title Company |
|---|---|---|---|
| Garley Sheila G | -- | None Listed On Document | |
| Garley James T | -- | None Available | |
| Garley James | $141,000 | -- |
Source: Public Records
Mortgage History
| Date | Status | Borrower | Loan Amount |
|---|---|---|---|
| Previous Owner | Garley James | $112,800 |
Source: Public Records
Tax History
| Year | Tax Paid | Tax Assessment Tax Assessment Total Assessment is a certain percentage of the fair market value that is determined by local assessors to be the total taxable value of land and additions on the property. | Land | Improvement |
|---|---|---|---|---|
| 2025 | $14,106 | $969,500 | $500,000 | $469,500 |
| 2024 | $13,631 | $969,500 | $500,000 | $469,500 |
| 2023 | $13,631 | $969,500 | $500,000 | $469,500 |
| 2022 | $13,156 | $969,500 | $500,000 | $469,500 |
| 2021 | $13,040 | $969,500 | $500,000 | $469,500 |
| 2020 | $13,040 | $969,500 | $500,000 | $469,500 |
| 2019 | $13,040 | $969,500 | $500,000 | $469,500 |
| 2018 | $11,973 | $969,500 | $500,000 | $469,500 |
| 2017 | $11,682 | $969,500 | $500,000 | $469,500 |
| 2016 | $12,255 | $641,300 | $205,000 | $436,300 |
| 2015 | $12,594 | $656,300 | $220,000 | $436,300 |
| 2014 | $12,312 | $636,300 | $200,000 | $436,300 |
Source: Public Records
Map
Nearby Homes
Your Personal Tour Guide
Ask me questions while you tour the home.