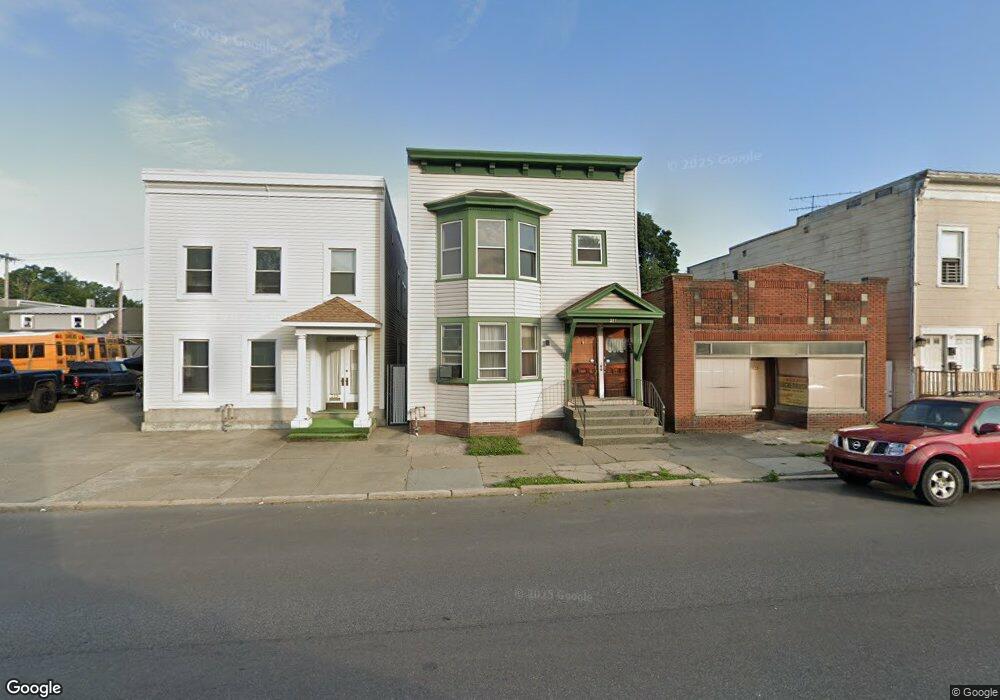
321 5th Ave Troy, NY 12182
Lansingburgh NeighborhoodEstimated Value: $172,480 - $238,000
6
Beds
2
Baths
2,542
Sq Ft
$79/Sq Ft
Est. Value
About This Home
This home is located at 321 5th Ave, Troy, NY 12182 and is currently estimated at $201,370, approximately $79 per square foot. 321 5th Ave is a home located in Rensselaer County with nearby schools including Turnpike Elementary School, Rensselaer Park Elementary School, and Knickerbacker Middle School.
Ownership History
Date
Name
Owned For
Owner Type
Purchase Details
Closed on
Feb 15, 2018
Sold by
Lourida Aaron
Bought by
Hudson Delta Llc
Current Estimated Value
Purchase Details
Closed on
Oct 21, 2005
Sold by
Shulusky Bruce
Bought by
Reo Properties Corp
Purchase Details
Closed on
Aug 30, 2004
Sold by
Burns William J Catherine P
Bought by
Shulusky Bruce
Create a Home Valuation Report for This Property
The Home Valuation Report is an in-depth analysis detailing your home's value as well as a comparison with similar homes in the area
Home Values in the Area
Average Home Value in this Area
Purchase History
| Date | Buyer | Sale Price | Title Company |
|---|---|---|---|
| Hudson Delta Llc | $32,400 | -- | |
| Hudson Delta Llc | $32,400 | -- | |
| Reo Properties Corp | $110,787 | Steven Baum | |
| Shulusky Bruce | $68,900 | -- |
Source: Public Records
Mortgage History
| Date | Status | Borrower | Loan Amount |
|---|---|---|---|
| Previous Owner | Hudson Delta Llc | $12,000 | |
| Previous Owner | Hudson Delta Llc | $64,000 |
Source: Public Records
Tax History
| Year | Tax Paid | Tax Assessment Tax Assessment Total Assessment is a certain percentage of the fair market value that is determined by local assessors to be the total taxable value of land and additions on the property. | Land | Improvement |
|---|---|---|---|---|
| 2024 | $3,427 | $75,000 | $8,800 | $66,200 |
| 2023 | $2,448 | $75,000 | $8,800 | $66,200 |
| 2022 | $3,386 | $75,000 | $8,800 | $66,200 |
| 2021 | $970 | $75,000 | $8,800 | $66,200 |
| 2020 | $1,546 | $75,000 | $8,800 | $66,200 |
| 2019 | $2,327 | $75,000 | $8,800 | $66,200 |
| 2018 | $2,327 | $75,000 | $8,800 | $66,200 |
| 2017 | $1,837 | $75,000 | $8,800 | $66,200 |
| 2016 | $4,657 | $75,000 | $8,800 | $66,200 |
| 2015 | -- | $75,000 | $8,800 | $66,200 |
| 2014 | -- | $75,000 | $8,800 | $66,200 |
Source: Public Records
Map
Nearby Homes
Your Personal Tour Guide
Ask me questions while you tour the home.