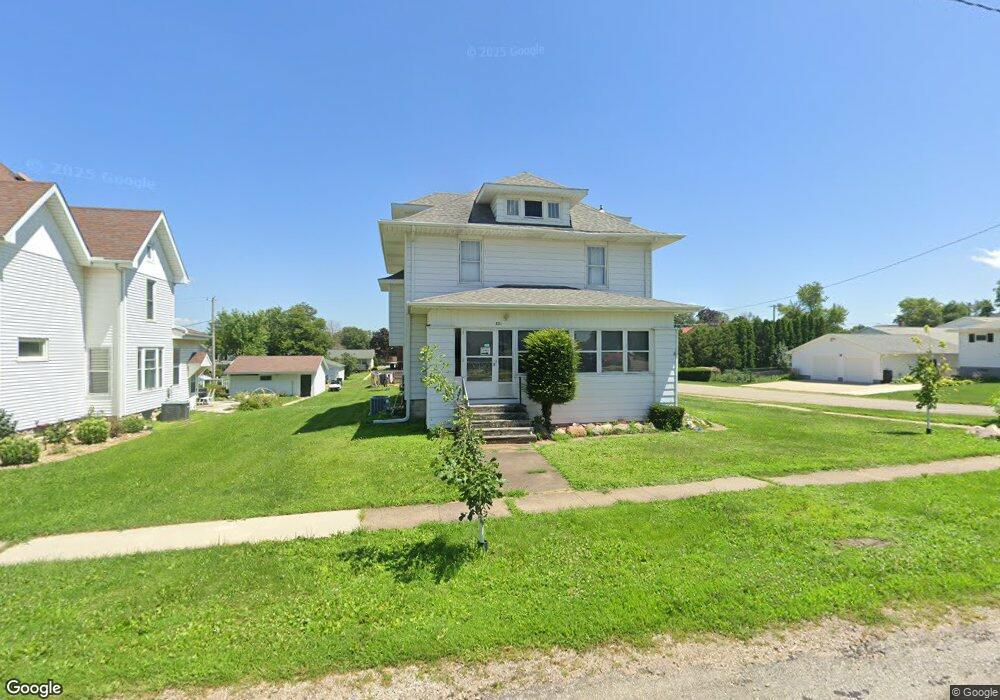
321 6th Ave Clarence, IA 52216
Estimated Value: $158,000 - $172,240
5
Beds
2
Baths
1,880
Sq Ft
$87/Sq Ft
Est. Value
About This Home
This home is located at 321 6th Ave, Clarence, IA 52216 and is currently estimated at $163,810, approximately $87 per square foot. 321 6th Ave is a home with nearby schools including North Cedar Junior/Senior High School.
Ownership History
Date
Name
Owned For
Owner Type
Purchase Details
Closed on
Jan 14, 2013
Sold by
Koth Aaron J
Bought by
Allen Jennifer Jo
Current Estimated Value
Purchase Details
Closed on
Feb 23, 2007
Sold by
Koth Gene and Koth Kathryn J
Bought by
Koth Aaron J and Koth Jennifer J
Home Financials for this Owner
Home Financials are based on the most recent Mortgage that was taken out on this home.
Original Mortgage
$76,500
Interest Rate
6.28%
Mortgage Type
New Conventional
Create a Home Valuation Report for This Property
The Home Valuation Report is an in-depth analysis detailing your home's value as well as a comparison with similar homes in the area
Purchase History
| Date | Buyer | Sale Price | Title Company |
|---|---|---|---|
| Allen Jennifer Jo | -- | None Available | |
| Koth Aaron J | $85,000 | None Available |
Source: Public Records
Mortgage History
| Date | Status | Borrower | Loan Amount |
|---|---|---|---|
| Previous Owner | Koth Aaron J | $76,500 |
Source: Public Records
Tax History
| Year | Tax Paid | Tax Assessment Tax Assessment Total Assessment is a certain percentage of the fair market value that is determined by local assessors to be the total taxable value of land and additions on the property. | Land | Improvement |
|---|---|---|---|---|
| 2025 | $2,258 | $157,230 | $14,260 | $142,970 |
| 2024 | $2,258 | $149,730 | $14,260 | $135,470 |
| 2023 | $2,088 | $142,950 | $14,260 | $128,690 |
| 2022 | $1,732 | $102,020 | $12,470 | $89,550 |
| 2021 | $1,766 | $102,020 | $12,470 | $89,550 |
| 2020 | $1,698 | $102,020 | $12,470 | $89,550 |
| 2019 | $1,492 | $84,350 | $12,470 | $89,550 |
| 2018 | $1,454 | $84,350 | $0 | $0 |
| 2017 | $1,454 | $91,190 | $0 | $0 |
| 2016 | $1,620 | $91,190 | $0 | $0 |
| 2015 | $1,600 | $91,190 | $0 | $0 |
| 2014 | $1,600 | $91,190 | $0 | $0 |
Source: Public Records
Map
Nearby Homes
- 401 7th Ave
- 410 9th Ave
- 507 1st Ave
- 1748 190th St
- 105 N Ash St
- 829 Union Ave
- 0 200th St Unit NOC6335338
- 602 Washington Ave
- 809 Jefferson Ave
- 501 Jefferson Ave
- 266 Hoover Hwy
- 98 1st St
- 84 Main St
- 1105 Iowa 38
- 1105 Highway 38
- 1310 Plum St
- 1 Lot Parkview Ln
- 2 Lot Parkview Ln
- 8 Lot Parkview Ln
- 1007 Parkview Dr
Your Personal Tour Guide
Ask me questions while you tour the home.