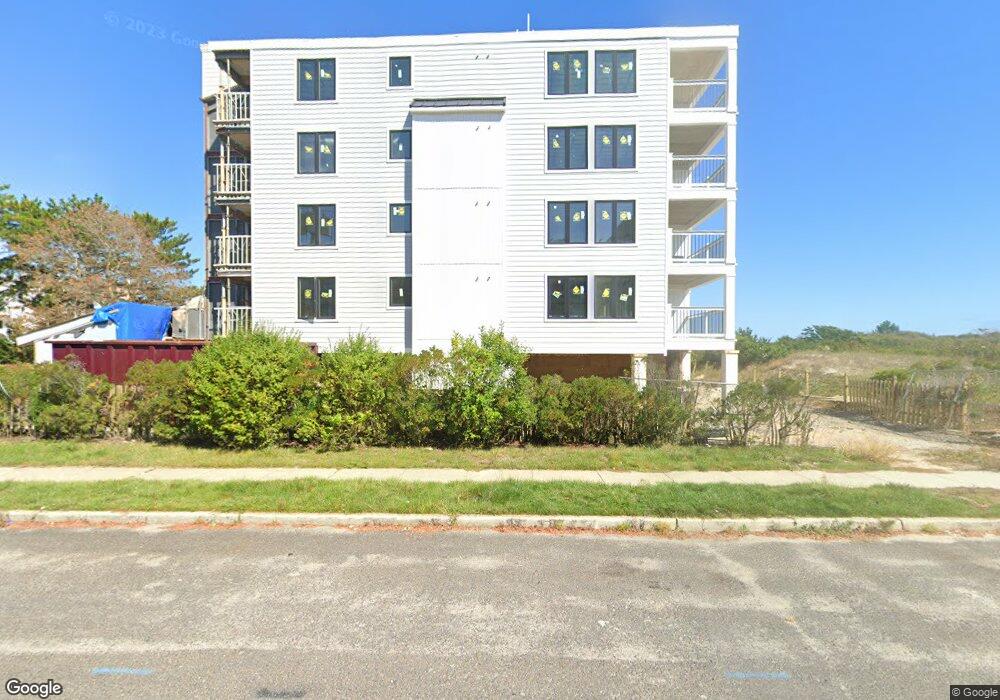
321 6th St S Unit 9 Brigantine, NJ 08203
Estimated Value: $626,000 - $763,000
1
Bed
1
Bath
768
Sq Ft
$928/Sq Ft
Est. Value
About This Home
This home is located at 321 6th St S Unit 9, Brigantine, NJ 08203 and is currently estimated at $713,074, approximately $928 per square foot. 321 6th St S Unit 9 is a home located in Atlantic County with nearby schools including Brigantine Community School and Brigantine Elementary School.
Ownership History
Date
Name
Owned For
Owner Type
Purchase Details
Closed on
Aug 27, 2025
Sold by
Rockwell Brigantine Ii Llc
Bought by
321 6-9 6Th Street Llc
Current Estimated Value
Purchase Details
Closed on
Jun 26, 2024
Sold by
Rockwell Brigantine Ii Llc
Bought by
Rockwell Brigantine Ii Llc
Purchase Details
Closed on
Sep 19, 2022
Sold by
321 6-9 6Th Street Llc
Bought by
Rockwell Brigantine Ii Llc
Home Financials for this Owner
Home Financials are based on the most recent Mortgage that was taken out on this home.
Original Mortgage
$5,050,000
Interest Rate
6.61%
Mortgage Type
New Conventional
Purchase Details
Closed on
Jun 30, 2021
Sold by
Strauss Diane R
Bought by
321 6-9 6Th Street Llc
Purchase Details
Closed on
Jul 7, 1999
Sold by
Gaerlan Mario G
Bought by
Strauss Diane R
Home Financials for this Owner
Home Financials are based on the most recent Mortgage that was taken out on this home.
Original Mortgage
$85,000
Interest Rate
7.03%
Mortgage Type
Purchase Money Mortgage
Purchase Details
Closed on
Jun 20, 1995
Sold by
Posatko Barbara Anne
Bought by
Gaerlan Mario G
Purchase Details
Closed on
Jun 23, 1989
Sold by
Bruce Mc Inc
Bought by
Posatko Barbara Anne
Create a Home Valuation Report for This Property
The Home Valuation Report is an in-depth analysis detailing your home's value as well as a comparison with similar homes in the area
Home Values in the Area
Average Home Value in this Area
Purchase History
| Date | Buyer | Sale Price | Title Company |
|---|---|---|---|
| 321 6-9 6Th Street Llc | $655,200 | None Listed On Document | |
| Rockwell Brigantine Ii Llc | -- | None Listed On Document | |
| Rockwell Brigantine Ii Llc | $250,000 | -- | |
| 321 6-9 6Th Street Llc | -- | City Line Abstract | |
| Strauss Diane R | $143,500 | -- | |
| Gaerlan Mario G | $112,500 | -- | |
| Posatko Barbara Anne | $180,000 | -- |
Source: Public Records
Mortgage History
| Date | Status | Borrower | Loan Amount |
|---|---|---|---|
| Previous Owner | Rockwell Brigantine Ii Llc | $5,050,000 | |
| Previous Owner | Strauss Diane R | $85,000 |
Source: Public Records
Tax History Compared to Growth
Tax History
| Year | Tax Paid | Tax Assessment Tax Assessment Total Assessment is a certain percentage of the fair market value that is determined by local assessors to be the total taxable value of land and additions on the property. | Land | Improvement |
|---|---|---|---|---|
| 2025 | $6,384 | $339,600 | $250,000 | $89,600 |
| 2024 | $6,384 | $339,600 | $250,000 | $89,600 |
| 2023 | $5,899 | $339,600 | $250,000 | $89,600 |
| 2022 | $5,899 | $339,600 | $250,000 | $89,600 |
| 2021 | $5,794 | $339,600 | $250,000 | $89,600 |
| 2020 | $5,732 | $339,600 | $250,000 | $89,600 |
| 2019 | $5,783 | $339,600 | $250,000 | $89,600 |
| 2018 | $5,899 | $339,600 | $250,000 | $89,600 |
| 2017 | $5,994 | $339,600 | $250,000 | $89,600 |
| 2016 | $5,991 | $339,600 | $250,000 | $89,600 |
| 2015 | $6,021 | $339,600 | $250,000 | $89,600 |
| 2014 | $5,797 | $339,600 | $250,000 | $89,600 |
Source: Public Records
Map
Nearby Homes
- 321 6th St S Unit 2
- 321 6th St S Unit 14
- 321 6th St S Unit 1
- 321 6th St S Unit 16
- 321 6th St S Unit 8
- 321 6th St S Unit 4
- 800 W Brigantine Ave Unit 217
- 223 8th St S
- 222 8th St S
- 900 W Brigantine Ave
- 136 5th St S
- 159 Sheridan Square
- 1000 W Brigantine Ave Unit 4
- 114 E Brigantine Ave Unit B
- 250 11th St S
- 150 9th St S
- 202 E Brigantine Ave
- 6th Rum Point Ct
- 300 E Brigantine Ave Unit 11
- 312 13th St S
- 321 6th St S
- 321 6th St S
- 321 6th St S
- 321 6th St S Unit 11
- 321 6th St S
- 321 6th St S
- 321 6th St S Unit 6
- 321 6th St S
- 321 6th St S
- 321 6th St S
- 321 6th St S Unit 15
- 321 6th Unit 14 St Unit 14
- 361 6th St S Unit 2
- 312 5th St S Unit A
- 312 5th St S Unit 312
- 320 5th St S Unit 2
- 320 5th St S Unit 3
- 320 5th St S
- 320 5th St S
- 320 5th St S Unit 4