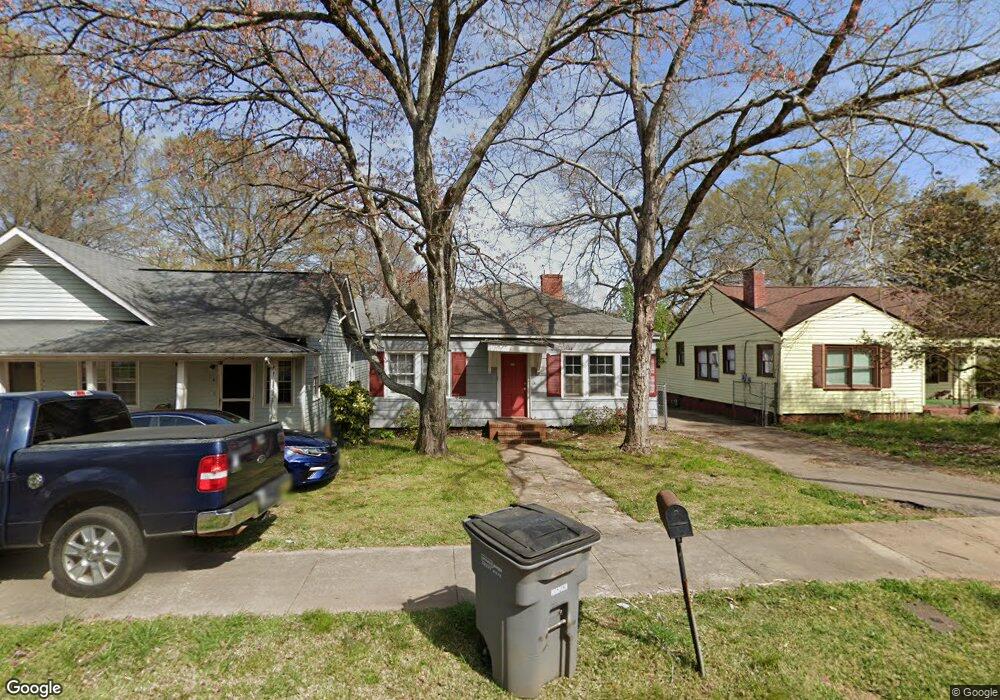
321 Alford St Lagrange, GA 30240
Estimated Value: $94,939 - $129,000
2
Beds
1
Bath
1,186
Sq Ft
$94/Sq Ft
Est. Value
About This Home
This home is located at 321 Alford St, Lagrange, GA 30240 and is currently estimated at $111,485, approximately $94 per square foot. 321 Alford St is a home located in Troup County with nearby schools including Hollis Hand Elementary School, Ethel W. Kight Elementary School, and Franklin Forest Elementary School.
Ownership History
Date
Name
Owned For
Owner Type
Purchase Details
Closed on
May 5, 2011
Sold by
Secretary Of Housing
Bought by
Edelson Stephen
Current Estimated Value
Purchase Details
Closed on
Sep 7, 2010
Sold by
Cain Sharon B
Bought by
Wells Fargo Bank Na
Purchase Details
Closed on
Oct 7, 2008
Sold by
Cain Sharon B
Bought by
Carlton Lacy
Purchase Details
Closed on
Aug 18, 2003
Sold by
Krista Andrew and Krista Overby
Bought by
Cain Sharon B
Purchase Details
Closed on
Jun 8, 2000
Sold by
Federal National Mortg Assoc
Bought by
Krista Andrew and Krista Overby
Purchase Details
Closed on
Jun 7, 2000
Sold by
Regions Mortgage Inc
Bought by
Federal National Mortg Assoc
Purchase Details
Closed on
Mar 7, 2000
Sold by
Jennifer L Stelt
Bought by
Regions Mortgage Inc
Purchase Details
Closed on
Jun 27, 1996
Sold by
Jas Huff and Jas Pauline
Bought by
Jennifer L Stelt
Purchase Details
Closed on
Jan 1, 1965
Sold by
Brumloe J E
Bought by
Jas Huff and Jas Pauline
Create a Home Valuation Report for This Property
The Home Valuation Report is an in-depth analysis detailing your home's value as well as a comparison with similar homes in the area
Purchase History
We collect this data history from publicly available records. To have your information removed, we recommend requesting removal directly through your county’s website.
| Date | Buyer | Sale Price | Title Company |
|---|---|---|---|
| Edelson Stephen | $20,050 | -- | |
| Wells Fargo Bank Na | $60,301 | -- | |
| Carlton Lacy | $58,619 | -- | |
| Cain Sharon B | $64,000 | -- | |
| Krista Andrew | $41,800 | -- | |
| Federal National Mortg Assoc | -- | -- | |
| Regions Mortgage Inc | $45,000 | -- | |
| Jennifer L Stelt | $42,500 | -- | |
| Jas Huff | -- | -- |
Source: Public Records
Tax History
| Year | Tax Paid | Tax Assessment Tax Assessment Total Assessment is a certain percentage of the fair market value that is determined by local assessors to be the total taxable value of land and additions on the property. | Land | Improvement |
|---|---|---|---|---|
| 2025 | $663 | $24,312 | $2,840 | $21,472 |
| 2024 | $569 | $20,872 | $2,840 | $18,032 |
| 2023 | $533 | $1,517 | $0 | $1,517 |
| 2022 | $521 | $18,672 | $2,840 | $15,832 |
| 2021 | $415 | $13,764 | $2,840 | $10,924 |
| 2020 | $415 | $13,764 | $2,840 | $10,924 |
| 2019 | $367 | $12,152 | $2,640 | $9,512 |
| 2018 | $367 | $12,152 | $2,640 | $9,512 |
| 2017 | $367 | $12,152 | $2,640 | $9,512 |
| 2016 | $359 | $11,907 | $2,640 | $9,267 |
| 2015 | $366 | $12,129 | $2,862 | $9,267 |
| 2014 | $352 | $11,641 | $2,862 | $8,779 |
| 2013 | -- | $13,194 | $2,862 | $10,332 |
Source: Public Records
Map
Nearby Homes
- 408 Harwell Ave
- 304 Boulevard
- 208 Boulevard
- 405 W Broome St Unit 2
- 405 W Broome St Unit 3
- 405 W Broome St Unit 4
- 405 W Broome St Unit 1
- 405 W Broome St Unit 5
- 207 Wilkes St
- 509 S Lewis St
- 206 Broad St
- TRACT 1 W Haralson St
- 600 Park Ave
- 501 Milam St
- 217 Jefferson St
- 303 E Mulberry St
- 914 Todd St
- 203 Fannin St
- 606 Poplar St
- 0 N Lee St Unit 10550825
- 323 Alford St
- 319 Alford St
- 325 Alford St
- 327 Alford St
- 315 Alford St
- 318 Alford St
- 313 Alford St
- 312 Harwell Ave
- 314 Harwell Ave Unit 8
- 314 Harwell Ave Unit 1
- 314 Harwell Ave Unit 7
- 314 Harwell Ave Unit 2
- 314 Harwell Ave Unit 3
- 314 Harwell Ave
- 314 Harwell Ave Unit 5
- 314 Harwell Ave Unit 4
- 314 Harwell Ave Unit 6
- 310 Harwell Ave
- 400 Ashton St
- 320 Alford St
Your Personal Tour Guide
Ask me questions while you tour the home.