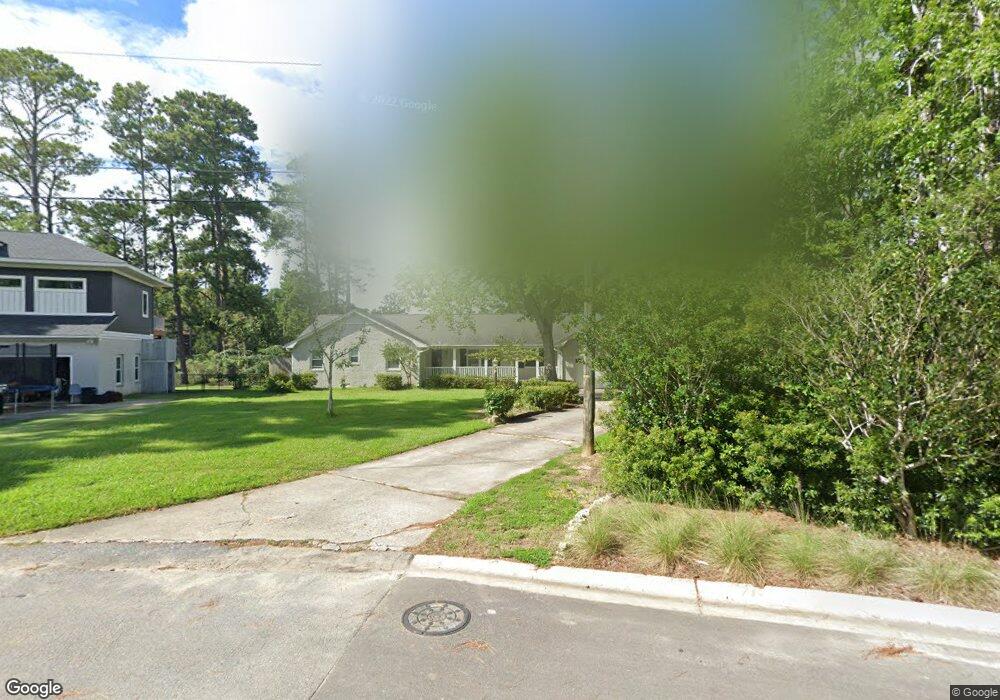
321 Blackbeard Rd E Wilmington, NC 28409
Masonboro NeighborhoodEstimated Value: $582,337 - $799,000
4
Beds
3
Baths
1,916
Sq Ft
$350/Sq Ft
Est. Value
About This Home
This home is located at 321 Blackbeard Rd E, Wilmington, NC 28409 and is currently estimated at $670,084, approximately $349 per square foot. 321 Blackbeard Rd E is a home with nearby schools including Masonboro Elementary School, Roland-Grise Middle School, and John T. Hoggard High School.
Ownership History
Date
Name
Owned For
Owner Type
Purchase Details
Closed on
May 18, 2015
Sold by
Umbrella Enterprise Group Llc
Bought by
Dunn Frank H
Current Estimated Value
Purchase Details
Closed on
Mar 14, 2005
Sold by
Barefoot Ovalee E and Barefoot Julia H
Bought by
Barefoot Ovalee E and Barefoot Julia H
Purchase Details
Closed on
Jun 4, 2003
Sold by
Barefoot Ovalee E Julia H
Bought by
Barefoot Living Trust
Purchase Details
Closed on
Feb 1, 1981
Sold by
Smith George Harold
Bought by
Barefoot Ovalee E Julia H
Purchase Details
Closed on
Nov 1, 1971
Bought by
Smith George Harold
Create a Home Valuation Report for This Property
The Home Valuation Report is an in-depth analysis detailing your home's value as well as a comparison with similar homes in the area
Home Values in the Area
Average Home Value in this Area
Purchase History
| Date | Buyer | Sale Price | Title Company |
|---|---|---|---|
| Dunn Frank H | -- | None Available | |
| Barefoot Ovalee E | -- | None Available | |
| Barefoot Living Trust | -- | -- | |
| Barefoot Ovalee E Julia H | $95,000 | -- | |
| Smith George Harold | -- | -- |
Source: Public Records
Tax History
| Year | Tax Paid | Tax Assessment Tax Assessment Total Assessment is a certain percentage of the fair market value that is determined by local assessors to be the total taxable value of land and additions on the property. | Land | Improvement |
|---|---|---|---|---|
| 2025 | $3,897 | $662,200 | $334,700 | $327,500 |
| 2023 | $2,918 | $345,300 | $169,800 | $175,500 |
| 2022 | $2,935 | $345,300 | $169,800 | $175,500 |
| 2021 | $2,955 | $345,300 | $169,800 | $175,500 |
| 2020 | $3,544 | $336,400 | $179,400 | $157,000 |
| 2019 | $3,544 | $336,400 | $179,400 | $157,000 |
| 2018 | $3,544 | $336,400 | $179,400 | $157,000 |
| 2017 | $3,544 | $336,400 | $179,400 | $157,000 |
| 2016 | $3,335 | $301,000 | $149,500 | $151,500 |
| 2015 | $3,188 | $301,000 | $149,500 | $151,500 |
| 2014 | $3,052 | $301,000 | $149,500 | $151,500 |
Source: Public Records
Map
Nearby Homes
- 318 Buccaneer Rd
- 4025 Watersail Dr
- 2425 Alford Landing Dr
- 2525 Royal Palm Ln
- 3345 Jasper Place Unit 1515
- 5416 Andrews Reach Loop
- 5408 Ibis Ct
- 3164 Painted Turtle Loop Unit 6
- 3164 Painted Turtle Loop
- 3160 Painted Turtle Loop Unit 7
- 229 Saint Luke Ct
- 3118 Painted Turtle Loop Unit 21
- 3920 Watersail Dr Unit 87
- 3927 Watersail Dr Unit 93
- 6424 Head Rd
- 1207 Upper Reach Dr
- 116 Kelly Rd
- 4206 Watersail Dr Unit 155
- 609 Sandfiddler Pointe Rd
- 3217 Sunset Bend Ct Unit 144
- 317 E Blackbeard Rd
- 325 E Blackbeard Rd
- 313 E Blackbeard Rd
- 310 E Blackbeard Rd
- 3901 Runnel
- 309 E Blackbeard Rd
- 306 Buccaneer Rd
- 302 Buccaneer Rd
- 3911 E Runnel
- 400 E Blackbeard Rd
- 226 Buccaneer Rd
- 310 Buccaneer Rd
- 306 E Blackbeard Rd
- 305 E Blackbeard Rd
- 404 E Blackbeard Lot 17
- 3905 Runnel Ct
- 418 W Blackbeard Rd
- 218 Buccaneer Rd
- 421 W Blackbeard Rd
- 3915 Runnel Ct
Your Personal Tour Guide
Ask me questions while you tour the home.