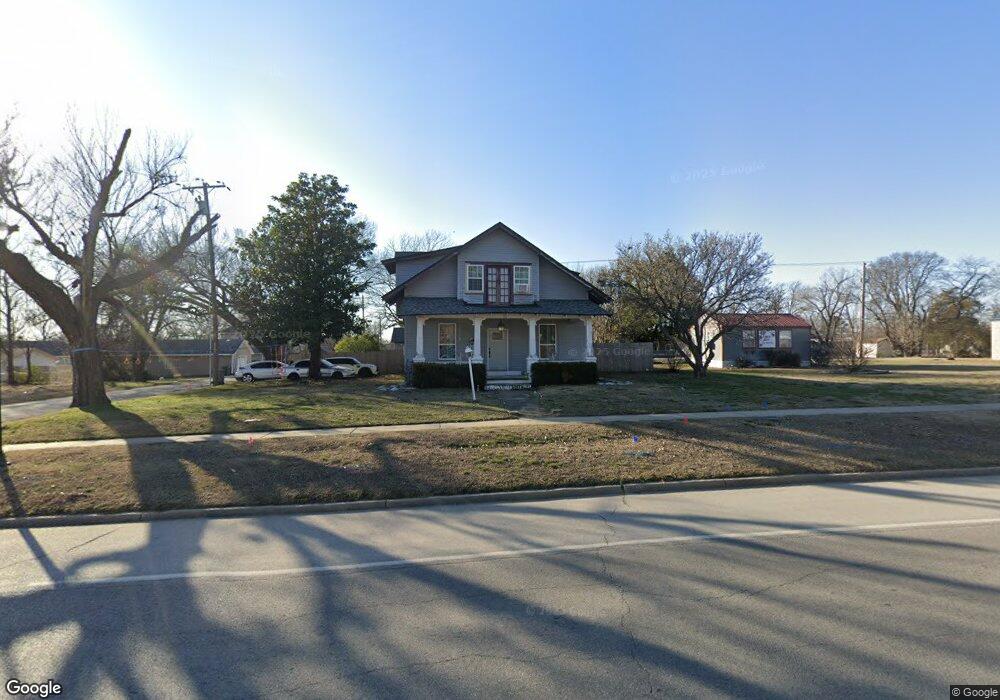
321 Broadway Haskell, OK 74436
Estimated Value: $112,000 - $156,000
3
Beds
2
Baths
1,804
Sq Ft
$74/Sq Ft
Est. Value
About This Home
This home is located at 321 Broadway, Haskell, OK 74436 and is currently estimated at $134,356, approximately $74 per square foot. 321 Broadway is a home located in Muskogee County with nearby schools including Mary White Elementary School, Haskell Middle School, and Haskell High School.
Ownership History
Date
Name
Owned For
Owner Type
Purchase Details
Closed on
Apr 19, 2024
Sold by
Guerra Stephane G and Guerra Jose V
Bought by
Guerra Stephanie G
Current Estimated Value
Purchase Details
Closed on
Sep 28, 2017
Sold by
Petree Henry and Petree Cheryl
Bought by
Guerra Jose V and Guerra Stephanie Ortiz De
Home Financials for this Owner
Home Financials are based on the most recent Mortgage that was taken out on this home.
Original Mortgage
$72,750
Interest Rate
3.89%
Mortgage Type
New Conventional
Purchase Details
Closed on
Sep 16, 2005
Sold by
Lachner Myrtle Marie
Bought by
Smith Franklin and Smith Sharon
Home Financials for this Owner
Home Financials are based on the most recent Mortgage that was taken out on this home.
Original Mortgage
$53,600
Interest Rate
5.8%
Mortgage Type
New Conventional
Purchase Details
Closed on
Dec 21, 2001
Purchase Details
Closed on
Jul 1, 1987
Create a Home Valuation Report for This Property
The Home Valuation Report is an in-depth analysis detailing your home's value as well as a comparison with similar homes in the area
Purchase History
| Date | Buyer | Sale Price | Title Company |
|---|---|---|---|
| Guerra Stephanie G | -- | None Listed On Document | |
| Guerra Jose V | $75,000 | Pioneer Abstract & Title Co | |
| Prtree Henry | $35,500 | None Available | |
| Smith Franklin | $54,000 | None Available | |
| -- | -- | -- | |
| -- | -- | -- |
Source: Public Records
Mortgage History
| Date | Status | Borrower | Loan Amount |
|---|---|---|---|
| Previous Owner | Guerra Jose V | $72,750 | |
| Previous Owner | Smith Franklin | $53,600 |
Source: Public Records
Tax History
| Year | Tax Paid | Tax Assessment Tax Assessment Total Assessment is a certain percentage of the fair market value that is determined by local assessors to be the total taxable value of land and additions on the property. | Land | Improvement |
|---|---|---|---|---|
| 2025 | $394 | $3,312 | $578 | $2,734 |
| 2024 | $380 | $3,312 | $578 | $2,734 |
| 2023 | $380 | $3,155 | $578 | $2,577 |
| 2022 | $306 | $3,155 | $578 | $2,577 |
| 2021 | $837 | $8,281 | $413 | $7,868 |
| 2020 | $849 | $8,281 | $413 | $7,868 |
| 2019 | $834 | $8,282 | $413 | $7,869 |
| 2018 | $844 | $8,282 | $413 | $7,869 |
| 2017 | $578 | $5,731 | $412 | $5,319 |
| 2016 | $544 | $5,731 | $412 | $5,319 |
| 2015 | $553 | $5,731 | $412 | $5,319 |
| 2014 | $1 | $5,731 | $412 | $5,319 |
Source: Public Records
Map
Nearby Homes
- 626 S Chickasaw Ave
- 415 E Holly
- 0 S Seminole Ave
- 420 E Holly St E
- 762 S Cherokee Ave
- 766 S Cherokee Ave
- 0 S Osage Ave
- 0001 Highway 16
- 1 N 204th St W
- 410 W Franklin St
- 512 W Franklin St
- 908 W Commercial St
- 114 E Elm St
- 001 E Elm St
- 904 W Main St
- 606 N Broadway Ave
- 0 E Pine St
- 820 N Broadway
- 913 N Creek Ave
- 207 N Cattle Dr
- 208 Broadway
- 320 Broadway
- 100 Broadway
- 220 Broadway
- 502 Broadway
- 600 S Broadway Ave
- 510 Broadway
- 603 S Broadway Ave
- 501 S Broadway Ave
- 502 S Broadway Ave
- 112 E Holly St S
- 605 S Broadway Ave
- 109 W Holly St
- 515 South Creek
- 508 S Choctaw Ave
- 421 S Broadway Ave
- 506 S Choctaw Ave
- 500 S Creek Ave
- 402 Broadway
- 500 S Choctaw Ave
Your Personal Tour Guide
Ask me questions while you tour the home.