Estimated Value: $150,240 - $240,000
--
Bed
1
Bath
1,345
Sq Ft
$133/Sq Ft
Est. Value
About This Home
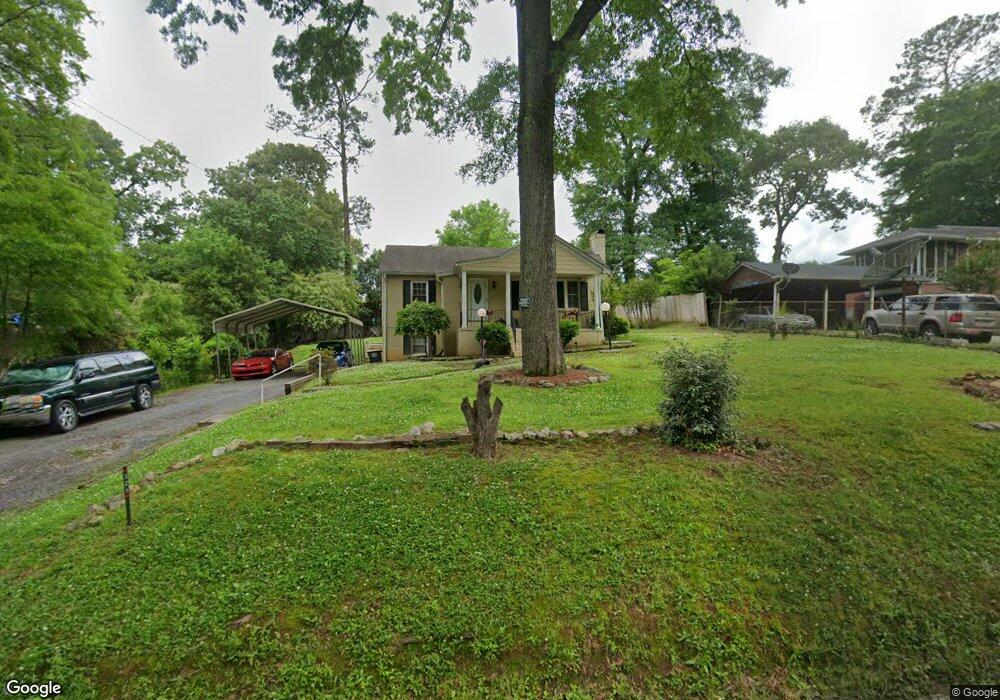
This home is located at 321 Brookwood Ave NW, Rome, GA 30165 and is currently estimated at $178,310, approximately $132 per square foot. 321 Brookwood Ave NW is a home located in Floyd County with nearby schools including Rome High School and St. Mary School.
Ownership History
Date
Name
Owned For
Owner Type
Purchase Details
Closed on
Mar 6, 2017
Sold by
Sams Hope
Bought by
Brown Carl Eugene and Brown Karen E
Current Estimated Value
Home Financials for this Owner
Home Financials are based on the most recent Mortgage that was taken out on this home.
Original Mortgage
$78,057
Outstanding Balance
$65,139
Interest Rate
4.4%
Mortgage Type
FHA
Estimated Equity
$113,171
Purchase Details
Closed on
Apr 20, 1998
Sold by
Marshall Bernard A and Doris Marshall
Bought by
Sams Hope
Purchase Details
Closed on
Apr 24, 1986
Sold by
Roberson Betty B
Bought by
Marshall Bernard A and Doris Marshall
Purchase Details
Closed on
May 13, 1985
Sold by
Roberson Ira Lee
Bought by
Roberson Betty B
Purchase Details
Closed on
May 21, 1970
Sold by
Watson Wm D and Watson Sadie M
Bought by
Roberson Ira Lee
Purchase Details
Closed on
Aug 28, 1969
Sold by
Fincher Harry G and Fincher Ruby W
Bought by
Watson Wm D and Watson Sadie M
Purchase Details
Closed on
Dec 2, 1968
Sold by
Custom Home Bldrs Inc
Bought by
Fincher Harry G and Fincher Ruby W
Purchase Details
Closed on
Jul 9, 1968
Sold by
Baker Noel
Bought by
Custom Home Bldrs Inc
Purchase Details
Closed on
Jun 23, 1952
Bought by
Baker Noel
Create a Home Valuation Report for This Property
The Home Valuation Report is an in-depth analysis detailing your home's value as well as a comparison with similar homes in the area
Home Values in the Area
Average Home Value in this Area
Purchase History
| Date | Buyer | Sale Price | Title Company |
|---|---|---|---|
| Brown Carl Eugene | $79,500 | -- | |
| Sams Hope | $43,000 | -- | |
| Marshall Bernard A | $15,500 | -- | |
| Roberson Betty B | -- | -- | |
| Roberson Ira Lee | $4,500 | -- | |
| Watson Wm D | $2,000 | -- | |
| Fincher Harry G | -- | -- | |
| Custom Home Bldrs Inc | -- | -- | |
| Baker Noel | -- | -- |
Source: Public Records
Mortgage History
| Date | Status | Borrower | Loan Amount |
|---|---|---|---|
| Open | Brown Carl Eugene | $78,057 |
Source: Public Records
Tax History Compared to Growth
Tax History
| Year | Tax Paid | Tax Assessment Tax Assessment Total Assessment is a certain percentage of the fair market value that is determined by local assessors to be the total taxable value of land and additions on the property. | Land | Improvement |
|---|---|---|---|---|
| 2024 | $2,047 | $52,724 | $8,709 | $44,015 |
| 2023 | $1,273 | $36,244 | $7,742 | $28,502 |
| 2022 | $1,249 | $34,215 | $6,451 | $27,764 |
| 2021 | $1,148 | $30,943 | $6,451 | $24,492 |
| 2020 | $1,045 | $27,935 | $4,838 | $23,097 |
| 2019 | $982 | $26,520 | $4,838 | $21,682 |
| 2018 | $1,003 | $27,106 | $4,838 | $22,268 |
| 2017 | $899 | $24,295 | $4,838 | $19,457 |
| 2016 | $947 | $25,496 | $4,800 | $20,696 |
| 2015 | $869 | $25,496 | $4,800 | $20,696 |
| 2014 | $869 | $24,795 | $4,800 | $19,995 |
Source: Public Records
Map
Nearby Homes
- 317 Brookwood Ave NW
- 323 Brookwood Ave NW
- 314 Greenwood Ave NW
- 316 Greenwood Ave NW
- 315 Brookwood Ave NW
- 312 Greenwood Ave NW
- 318 Greenwood Ave NW
- 325 Brookwood Ave NW
- 320 Brookwood Ave NW
- 318 Brookwood Ave NW
- 322 Brookwood Ave NW
- 313 Brookwood Ave NW
- 316 Brookwood Ave NW
- 320 Greenwood Ave NW
- 310 Greenwood Ave NW
- 327 Brookwood Ave NW
- 326 Brookwood Ave NW
- 314 Brookwood Ave NW
- 0 Greenwood Ave NW Unit 7343007
- 0 Greenwood Ave NW Unit 7269480