321 Callies Haven Way Moncure, NC 27559
Estimated Value: $448,000 - $747,000
3
Beds
3
Baths
2,379
Sq Ft
$251/Sq Ft
Est. Value
About This Home
This home is located at 321 Callies Haven Way, Moncure, NC 27559 and is currently estimated at $596,788, approximately $250 per square foot. 321 Callies Haven Way is a home located in Chatham County with nearby schools including Pittsboro Elementary School, George Moses Horton Middle School, and Northwood High.
Ownership History
Date
Name
Owned For
Owner Type
Purchase Details
Closed on
Feb 11, 2009
Sold by
Roberson Preston Lee
Bought by
Roberson Melissa A and Roberson Preston Lee
Current Estimated Value
Create a Home Valuation Report for This Property
The Home Valuation Report is an in-depth analysis detailing your home's value as well as a comparison with similar homes in the area
Home Values in the Area
Average Home Value in this Area
Purchase History
| Date | Buyer | Sale Price | Title Company |
|---|---|---|---|
| Roberson Melissa A | -- | Chicago Title Insurance Co |
Source: Public Records
Tax History Compared to Growth
Tax History
| Year | Tax Paid | Tax Assessment Tax Assessment Total Assessment is a certain percentage of the fair market value that is determined by local assessors to be the total taxable value of land and additions on the property. | Land | Improvement |
|---|---|---|---|---|
| 2024 | $3,610 | $345,110 | $38,146 | $306,964 |
| 2023 | $3,131 | $345,110 | $38,146 | $306,964 |
| 2022 | $2,857 | $345,110 | $38,146 | $306,964 |
| 2021 | $2,857 | $345,110 | $38,146 | $306,964 |
| 2020 | $2,483 | $297,500 | $36,873 | $260,627 |
| 2019 | $2,483 | $297,500 | $36,873 | $260,627 |
| 2018 | $2,099 | $297,500 | $36,873 | $260,627 |
| 2017 | $2,099 | $267,488 | $36,873 | $230,615 |
| 2016 | $1,750 | $214,904 | $30,573 | $184,331 |
| 2015 | $1,725 | $214,904 | $30,573 | $184,331 |
| 2014 | $1,710 | $214,904 | $30,573 | $184,331 |
| 2013 | -- | $214,904 | $30,573 | $184,331 |
Source: Public Records
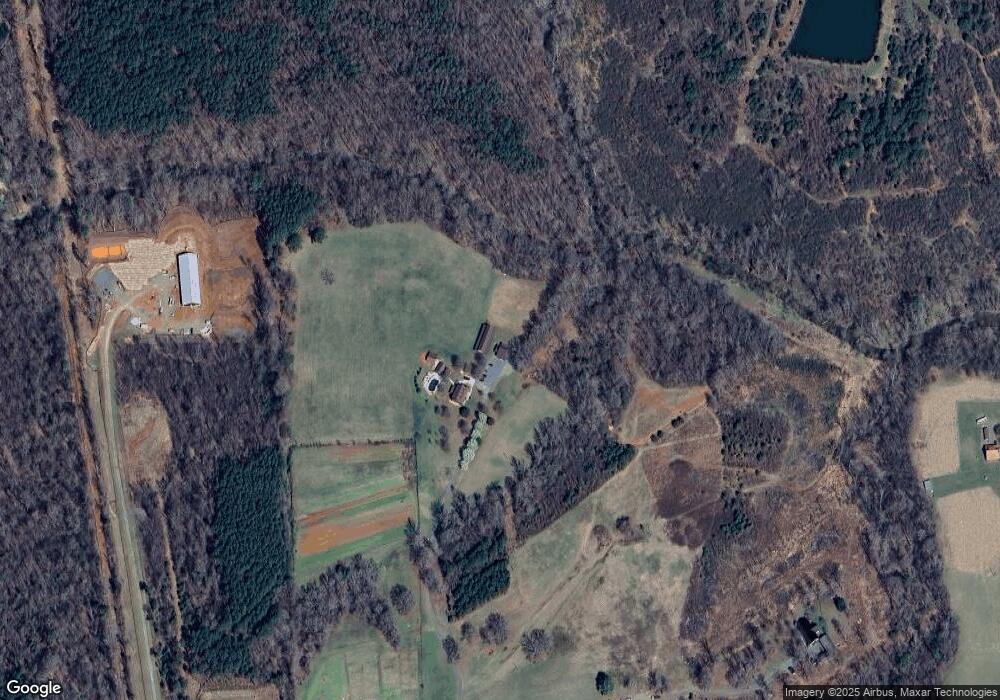
Map
Nearby Homes
- 344 May Farm Rd
- 122 Bridle Path
- 329 Windsong Dr
- 341 Windsong Dr
- 66 Toomer Loop Rd
- 1700 Moncure Pittsboro Rd
- 41 Cottage Way
- 298 E Salisbury St
- 0 Nc 87 Hwy Unit 2491586
- 501 U S 15
- 162 Gaines Trail
- 132 Bill Thomas Rd
- 24 Cynthia Ln
- 88 Daisy Scurlock Rd
- 334 Beacon Dr
- 338 Beacon Dr
- 339 Beacon Dr
- 49 Lesley Ct
- 335 Beacon Dr
- 331 Beacon Dr
- 285 Callies Haven Way
- 480 Mount Zion Rd
- 74 Brookridge Ct
- 77 Brookridge Ct
- 68 Brookridge Ct
- 65 Brookridge Ct
- 60 Brookridge Ct
- 63 Brookridge Ct
- 48 Breezewood Ct
- 52 Brookridge Ct
- 51 Breezewood Ct
- 44 Breezewood Ct
- 37 Brookridge Ct
- 36 Breezewood Ct
- 47 Breezewood Ct
- 40 Brookridge Ct
- 74 Windsong Dr
- 26 Brookridge Ct
- 23 Brookridge Ct
- 41 Breezewood Ct