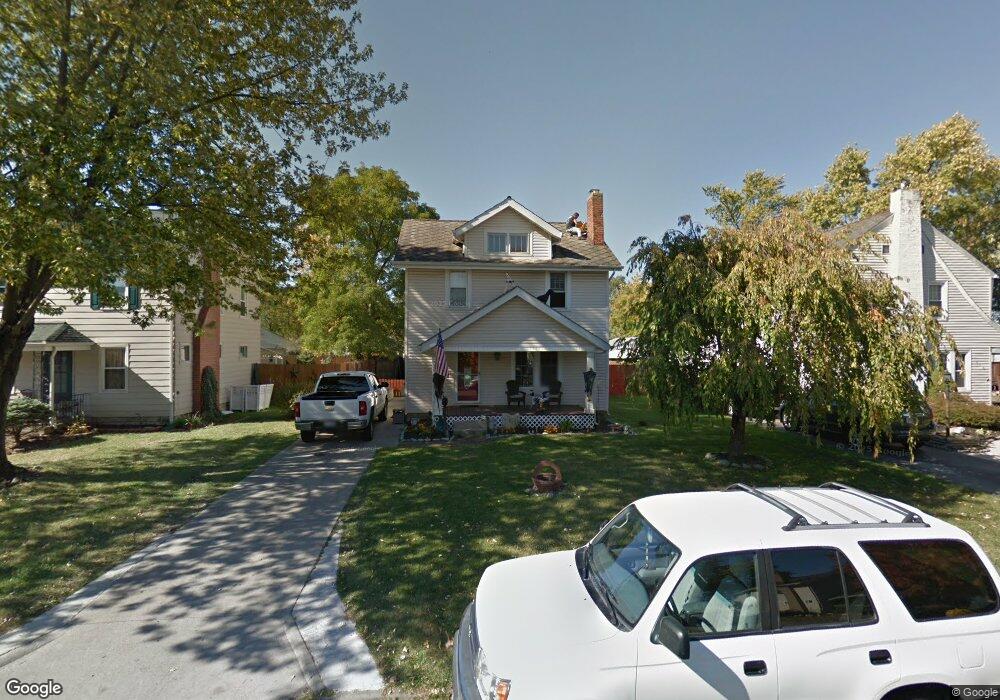
321 Demorest Rd Columbus, OH 43204
Westgate NeighborhoodEstimated Value: $185,000 - $237,000
3
Beds
1
Bath
1,229
Sq Ft
$175/Sq Ft
Est. Value
About This Home
This home is located at 321 Demorest Rd, Columbus, OH 43204 and is currently estimated at $214,842, approximately $174 per square foot. 321 Demorest Rd is a home located in Franklin County with nearby schools including Westgate Alternative Elementary School, Westmoor Middle School, and West High School.
Ownership History
Date
Name
Owned For
Owner Type
Purchase Details
Closed on
Oct 14, 2022
Sold by
Gulf Coast Partners Llc
Bought by
Capgrow Holdings Jv Sub Ix Llc
Current Estimated Value
Purchase Details
Closed on
Feb 23, 2021
Sold by
Morbitzer Deborah A
Bought by
Gulf Coast Partners Llc
Purchase Details
Closed on
Sep 18, 2001
Sold by
Barnhart Kimberly K
Bought by
Morbitzer Deborah A
Home Financials for this Owner
Home Financials are based on the most recent Mortgage that was taken out on this home.
Original Mortgage
$85,158
Interest Rate
6.72%
Mortgage Type
FHA
Purchase Details
Closed on
Aug 5, 1996
Sold by
Frauenberg James H
Bought by
Kimberly K Barnhart
Home Financials for this Owner
Home Financials are based on the most recent Mortgage that was taken out on this home.
Original Mortgage
$61,000
Interest Rate
8.33%
Mortgage Type
New Conventional
Purchase Details
Closed on
Jul 14, 1989
Purchase Details
Closed on
Jun 26, 1989
Create a Home Valuation Report for This Property
The Home Valuation Report is an in-depth analysis detailing your home's value as well as a comparison with similar homes in the area
Home Values in the Area
Average Home Value in this Area
Purchase History
| Date | Buyer | Sale Price | Title Company |
|---|---|---|---|
| Capgrow Holdings Jv Sub Ix Llc | $170,000 | First National Title Services | |
| Gulf Coast Partners Llc | $145,000 | Northwest Advantage Title Agen | |
| Morbitzer Deborah A | $87,000 | Chicago Title | |
| Kimberly K Barnhart | $68,000 | -- | |
| -- | $45,000 | -- | |
| -- | $45,000 | -- |
Source: Public Records
Mortgage History
| Date | Status | Borrower | Loan Amount |
|---|---|---|---|
| Previous Owner | Morbitzer Deborah A | $85,158 | |
| Previous Owner | Kimberly K Barnhart | $61,000 |
Source: Public Records
Tax History
| Year | Tax Paid | Tax Assessment Tax Assessment Total Assessment is a certain percentage of the fair market value that is determined by local assessors to be the total taxable value of land and additions on the property. | Land | Improvement |
|---|---|---|---|---|
| 2025 | $3,200 | $69,830 | $21,980 | $47,850 |
| 2024 | $3,200 | $69,830 | $21,980 | $47,850 |
| 2023 | $3,160 | $69,825 | $21,980 | $47,845 |
| 2022 | $2,201 | $41,410 | $8,400 | $33,010 |
| 2021 | $2,152 | $41,410 | $8,400 | $33,010 |
| 2020 | $2,154 | $41,410 | $8,400 | $33,010 |
| 2019 | $2,081 | $34,300 | $7,000 | $27,300 |
| 2018 | $1,968 | $34,300 | $7,000 | $27,300 |
| 2017 | $2,065 | $34,300 | $7,000 | $27,300 |
| 2016 | $2,050 | $30,940 | $7,700 | $23,240 |
| 2015 | $1,861 | $30,940 | $7,700 | $23,240 |
| 2014 | $1,865 | $30,940 | $7,700 | $23,240 |
| 2013 | $969 | $32,585 | $8,120 | $24,465 |
Source: Public Records
Map
Nearby Homes
- 408 Derrer Rd
- 328 S Sylvan Ave
- 227 S Sylvan Ave
- 277 Josephine Ave
- 162 S Southampton Ave
- 139 Demorest Ave
- 181 S Westgate Ave
- 144 S Brinker Ave
- 695 Demorest Rd
- 77 S Brinker Ave
- 570 S Westgate Ave
- 185 S Huron Ave
- 3001 Wicklow Rd
- 6280 Renner Park Dr
- 3096 Ellis Place
- 457 Guernsey Ave
- 814 Miriam Dr W
- 235 S Roys Ave
- 840 Mark Place
- 363 S Chase Ave
- 321 Demorest Rd
- 327 Demorest Rd
- 313 Demorest Rd
- 307 Demorest Ave
- 307 Demorest Rd
- 335 Demorest Rd
- 335 Demorest Rd
- 322 Derrer Rd Unit 324
- 322 Demorest Rd
- 301 Demorest Rd
- 328 Derrer Rd
- 316 Derrer Rd
- 328 Demorest Rd
- 314 Demorest Rd
- 336 Demorest Rd
- 308 Derrer Rd Unit 310
- 308 Demorest Rd
- 340 Derrer Rd
- 347 Demorest Rd
- 293 Demorest Rd
Your Personal Tour Guide
Ask me questions while you tour the home.