Estimated Value: $477,000 - $506,005
4
Beds
3
Baths
3,288
Sq Ft
$151/Sq Ft
Est. Value
About This Home
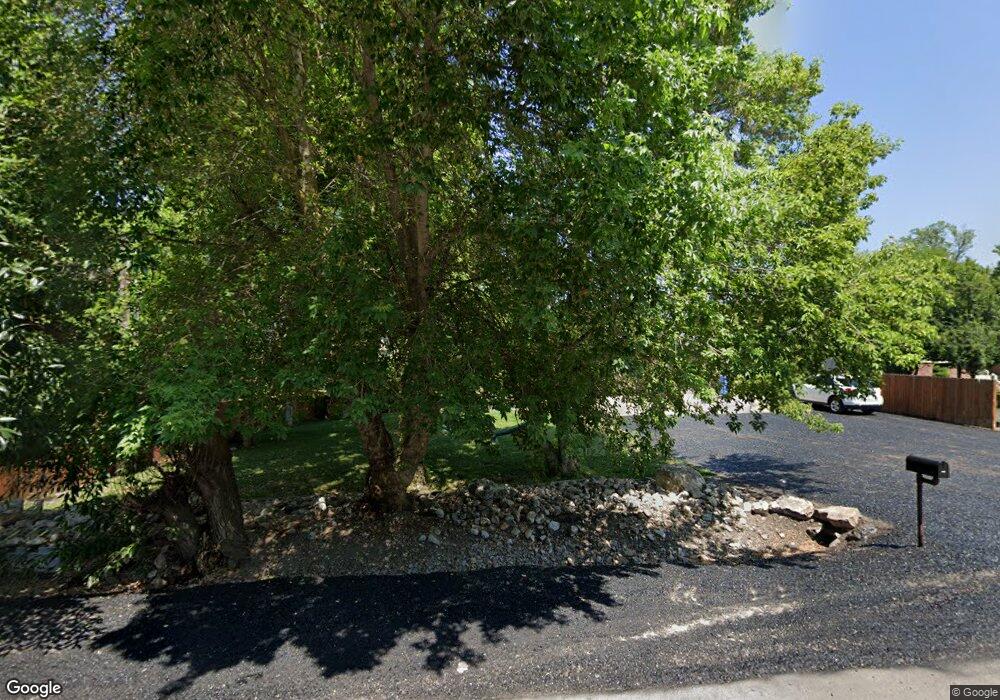
This home is located at 321 E 100 N, Hyrum, UT 84319 and is currently estimated at $496,001, approximately $150 per square foot. 321 E 100 N is a home located in Cache County with nearby schools including Lincoln School, South Cache Middle School, and Mountain Crest High School.
Ownership History
Date
Name
Owned For
Owner Type
Purchase Details
Closed on
Jun 11, 2007
Sold by
Gerber Rulon J and Gerber Betty Lou H
Bought by
Coombs Matt T and Coombs Amanda K
Current Estimated Value
Home Financials for this Owner
Home Financials are based on the most recent Mortgage that was taken out on this home.
Original Mortgage
$175,000
Outstanding Balance
$106,273
Interest Rate
6.14%
Mortgage Type
Construction
Estimated Equity
$389,728
Create a Home Valuation Report for This Property
The Home Valuation Report is an in-depth analysis detailing your home's value as well as a comparison with similar homes in the area
Home Values in the Area
Average Home Value in this Area
Purchase History
| Date | Buyer | Sale Price | Title Company |
|---|---|---|---|
| Coombs Matt T | -- | Northern Title Company |
Source: Public Records
Mortgage History
| Date | Status | Borrower | Loan Amount |
|---|---|---|---|
| Open | Coombs Matt T | $175,000 |
Source: Public Records
Tax History Compared to Growth
Tax History
| Year | Tax Paid | Tax Assessment Tax Assessment Total Assessment is a certain percentage of the fair market value that is determined by local assessors to be the total taxable value of land and additions on the property. | Land | Improvement |
|---|---|---|---|---|
| 2025 | $1,933 | $277,505 | $0 | $0 |
| 2024 | $2,080 | $278,900 | $0 | $0 |
| 2023 | $2,376 | $304,675 | $0 | $0 |
| 2022 | $2,480 | $304,675 | $0 | $0 |
| 2021 | $2,053 | $385,354 | $65,740 | $319,614 |
| 2020 | $1,915 | $340,100 | $65,740 | $274,360 |
| 2019 | $1,888 | $315,480 | $41,120 | $274,360 |
| 2018 | $1,771 | $286,085 | $41,120 | $244,965 |
| 2017 | $1,801 | $150,930 | $0 | $0 |
| 2016 | $1,842 | $147,910 | $0 | $0 |
| 2015 | $1,809 | $147,910 | $0 | $0 |
| 2014 | $1,765 | $147,570 | $0 | $0 |
| 2013 | -- | $147,570 | $0 | $0 |
Source: Public Records
Map
Nearby Homes