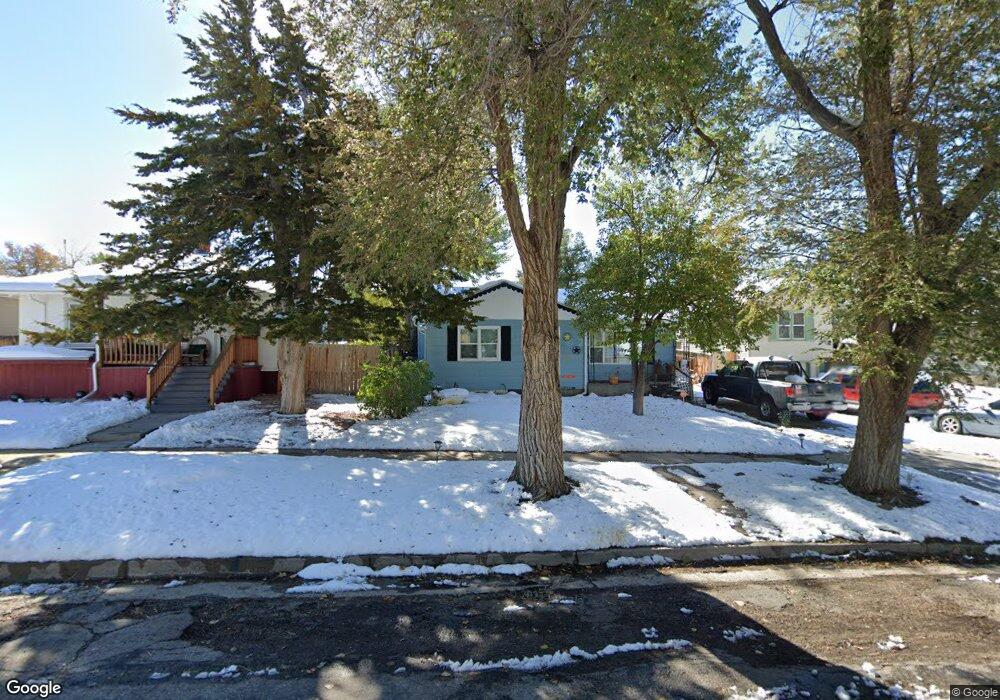
321 E 14th St Unit Durbin Street Casper, WY 82601
Central Casper NeighborhoodEstimated Value: $254,000 - $347,000
3
Beds
2
Baths
2,343
Sq Ft
$134/Sq Ft
Est. Value
About This Home
This home is located at 321 E 14th St Unit Durbin Street, Casper, WY 82601 and is currently estimated at $314,640, approximately $134 per square foot. 321 E 14th St Unit Durbin Street is a home located in Natrona County with nearby schools including Mountain Road Christian Academy.
Ownership History
Date
Name
Owned For
Owner Type
Purchase Details
Closed on
Jan 7, 2021
Sold by
Brainard Kevin
Bought by
Maffin Thomas and Maffin Donatella
Current Estimated Value
Home Financials for this Owner
Home Financials are based on the most recent Mortgage that was taken out on this home.
Original Mortgage
$195,000
Outstanding Balance
$174,008
Interest Rate
2.7%
Mortgage Type
VA
Estimated Equity
$140,632
Purchase Details
Closed on
Jan 31, 2019
Sold by
Hud
Bought by
Brainard Kevin
Purchase Details
Closed on
Mar 20, 2018
Sold by
Home Point Financial Corp
Bought by
Secretary Of Housing And Urban Developme
Purchase Details
Closed on
Mar 30, 2017
Sold by
Platte Valley Bank
Bought by
Stonegate Mortgage Corporation
Purchase Details
Closed on
Dec 23, 2014
Sold by
Mccarthy Edward P and Mccarthy Patricia Ann
Bought by
Ashurst Adam
Create a Home Valuation Report for This Property
The Home Valuation Report is an in-depth analysis detailing your home's value as well as a comparison with similar homes in the area
Home Values in the Area
Average Home Value in this Area
Purchase History
| Date | Buyer | Sale Price | Title Company |
|---|---|---|---|
| Maffin Thomas | -- | Rocky Mountain Title | |
| Brainard Kevin | -- | American Title Agency | |
| Secretary Of Housing And Urban Developme | -- | None Available | |
| Stonegate Mortgage Corporation | -- | None Available | |
| Ashurst Adam | -- | -- |
Source: Public Records
Mortgage History
| Date | Status | Borrower | Loan Amount |
|---|---|---|---|
| Open | Maffin Thomas | $195,000 |
Source: Public Records
Tax History Compared to Growth
Tax History
| Year | Tax Paid | Tax Assessment Tax Assessment Total Assessment is a certain percentage of the fair market value that is determined by local assessors to be the total taxable value of land and additions on the property. | Land | Improvement |
|---|---|---|---|---|
| 2025 | $1,532 | $21,336 | $2,829 | $18,507 |
| 2024 | $2,037 | $28,369 | $4,642 | $23,727 |
| 2023 | $1,977 | $27,117 | $4,303 | $22,814 |
| 2022 | $1,725 | $26,668 | $3,631 | $23,037 |
| 2021 | $1,511 | $20,730 | $3,751 | $16,979 |
| 2020 | $1,501 | $20,598 | $5,985 | $14,613 |
| 2019 | $1,397 | $19,168 | $3,658 | $15,510 |
| 2018 | $1,318 | $18,087 | $4,206 | $13,881 |
| 2017 | $1,332 | $18,280 | $4,206 | $14,074 |
| 2015 | $1,225 | $16,804 | $4,206 | $12,598 |
| 2014 | $1,207 | $16,565 | $4,206 | $12,359 |
Source: Public Records
Map
Nearby Homes
- 1244 S Durbin St
- 0 Casper Mountain Rd Unit 20256509
- 1227 S Center St
- 0 15th St Unit 20251555
- 203 W 15th St
- 603 E 13th St
- 1117 S Lincoln St
- 1010 S Durbin St
- 637 E 13th St
- 1007 S Wolcott St
- 730 E 15th St
- 1242 S Elm St
- 17th Street
- 428 W 12th St
- 205 E 8th St
- 1606 S Oak St
- 835 S Ash St
- 46000 U S Highway 20
- 623 S Wolcott St
- 1152 S Walnut St
- 321 E 14th St
- 321 E 14th St Unit Durbin
- 329 E 14th St
- 311 E 14th St
- 311 E 14th St Unit Durbin
- 1445 S Durbin St
- 1418 S Beech St
- 1408 S Beech St
- 305 E 14th St
- 310 E 15th St
- 328 E 15th St
- 1434 S Beech St
- 1447 S Durbin St
- 1343 S Durbin St
- 320 E 14th St Unit Durbin
- 324 E 14th St
- 1430 S Durbin St
- 1430 S Durbin St Unit E 15th
- 1342 S Beech St
- 1342 S Beech St Unit 13th