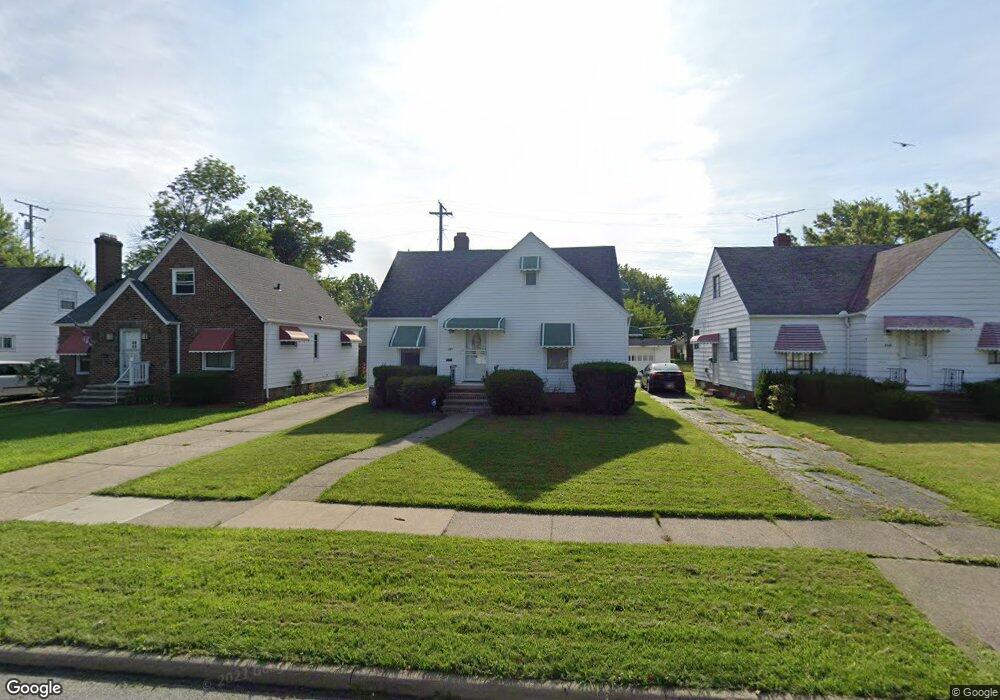
321 E 232nd St Euclid, OH 44123
Estimated Value: $134,000 - $142,000
4
Beds
1
Bath
1,353
Sq Ft
$102/Sq Ft
Est. Value
About This Home
This home is located at 321 E 232nd St, Euclid, OH 44123 and is currently estimated at $138,667, approximately $102 per square foot. 321 E 232nd St is a home located in Cuyahoga County with nearby schools including Bluestone Elementary School, Euclid High School, and Our Lady Of The Lake School.
Ownership History
Date
Name
Owned For
Owner Type
Purchase Details
Closed on
Jun 21, 2016
Sold by
Mjb Investment Properties Llc
Bought by
Cook Michelle
Current Estimated Value
Home Financials for this Owner
Home Financials are based on the most recent Mortgage that was taken out on this home.
Original Mortgage
$122,735
Outstanding Balance
$98,252
Interest Rate
3.75%
Mortgage Type
FHA
Estimated Equity
$40,415
Purchase Details
Closed on
Mar 30, 2015
Sold by
Pickett Carla L
Bought by
Mjb Investment Properties
Purchase Details
Closed on
Jun 12, 2008
Sold by
Prebevsek Mary J
Bought by
Pickett Carla L
Home Financials for this Owner
Home Financials are based on the most recent Mortgage that was taken out on this home.
Original Mortgage
$68,918
Interest Rate
6.09%
Mortgage Type
FHA
Purchase Details
Closed on
Feb 15, 1984
Sold by
Prebevsek Louis and Prebevsek Mary J
Bought by
Prebevsek Louis
Purchase Details
Closed on
Jan 1, 1975
Bought by
Prebevsek Louis and Prebevsek Mary J
Create a Home Valuation Report for This Property
The Home Valuation Report is an in-depth analysis detailing your home's value as well as a comparison with similar homes in the area
Home Values in the Area
Average Home Value in this Area
Purchase History
| Date | Buyer | Sale Price | Title Company |
|---|---|---|---|
| Cook Michelle | $125,000 | Chicago Title Insurance Co | |
| Mjb Investment Properties | $27,300 | None Available | |
| Pickett Carla L | $70,000 | Executive Title Agency Corp | |
| Prebevsek Louis | -- | -- | |
| Prebevsek Louis | -- | -- |
Source: Public Records
Mortgage History
| Date | Status | Borrower | Loan Amount |
|---|---|---|---|
| Open | Cook Michelle | $122,735 | |
| Previous Owner | Pickett Carla L | $68,918 |
Source: Public Records
Tax History
| Year | Tax Paid | Tax Assessment Tax Assessment Total Assessment is a certain percentage of the fair market value that is determined by local assessors to be the total taxable value of land and additions on the property. | Land | Improvement |
|---|---|---|---|---|
| 2024 | $3,028 | $43,890 | $8,365 | $35,525 |
| 2023 | $2,623 | $30,170 | $6,090 | $24,080 |
| 2022 | $2,563 | $30,170 | $6,090 | $24,080 |
| 2021 | $2,857 | $30,170 | $6,090 | $24,080 |
| 2020 | $2,898 | $27,930 | $5,640 | $22,300 |
| 2019 | $2,606 | $79,800 | $16,100 | $63,700 |
| 2018 | $2,915 | $27,930 | $5,640 | $22,300 |
| 2017 | $2,811 | $24,960 | $5,530 | $19,430 |
| 2016 | $2,883 | $24,960 | $5,530 | $19,430 |
| 2015 | $3,198 | $24,960 | $5,530 | $19,430 |
| 2014 | $3,487 | $24,960 | $5,530 | $19,430 |
Source: Public Records
Map
Nearby Homes
- 324 E 235th St
- 323 E 235th St
- 303 E 235th St
- 334 E 238th St
- 244 E 238th St
- 23198 Gay St
- 55 Sunnycliff Dr
- 71 Lake Edge Dr
- 110 E 238th St
- 325 E 244th St
- 170 E 220th St
- 368 E 248th St
- 24181 Devoe Ave
- 461 Kenwood Dr Unit T3
- 24891 Zeman Ave
- 470 Kenwood Dr Unit D
- 450 Kenwood Dr Unit E12
- 104 E 219th St
- 490 Kenwood Dr Unit B
- 464 E 250th St
- 325 E 232nd St
- 331 E 232nd St
- 311 E 232nd St
- 335 E 232nd St
- 305 E 232nd St
- 310 Buckner Dr Unit 203
- 306 Buckner Dr Unit 205
- 308 Buckner Dr Unit 204
- 312 Buckner Dr Unit 202
- 324 E 232nd St
- 318 E 232nd St
- 328 E 232nd St
- 341 E 232nd St
- 301 E 232nd St
- 314 E 232nd St
- 334 E 232nd St
- 23387 Farringdon Ave Unit 54
- 23385 Farringdon Ave Unit 83
- 23395 Farringdon Ave
- 23391 Farringdon Ave
Your Personal Tour Guide
Ask me questions while you tour the home.