Estimated Value: $136,000 - $238,000
4
Beds
2
Baths
2,318
Sq Ft
$79/Sq Ft
Est. Value
About This Home
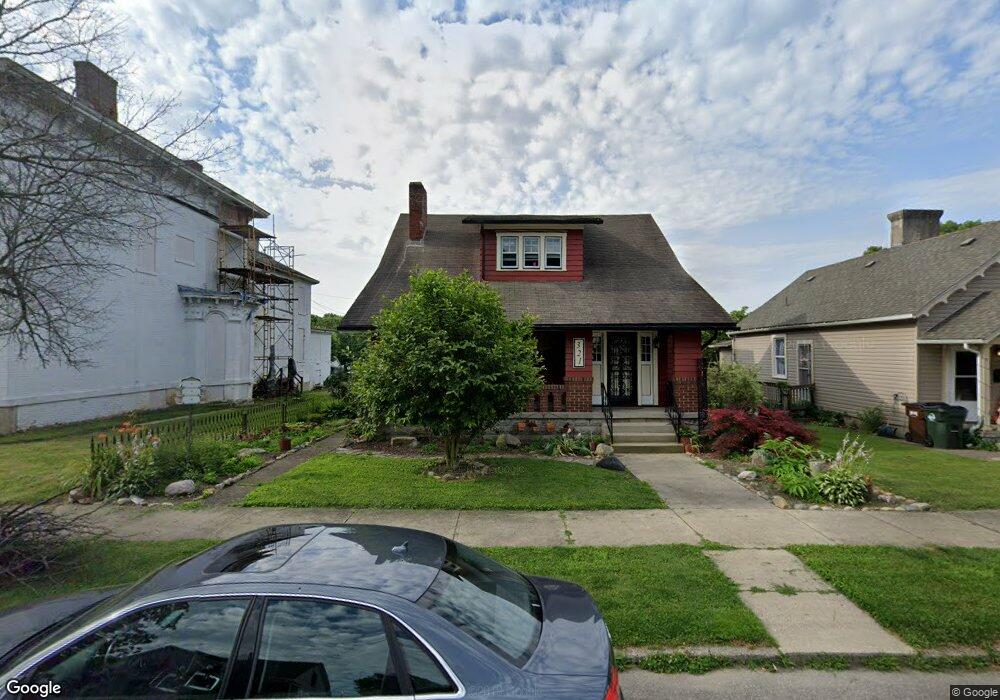
This home is located at 321 E 2nd St, Xenia, OH 45385 and is currently estimated at $182,180, approximately $78 per square foot. 321 E 2nd St is a home located in Greene County with nearby schools including Xenia High School, Summit Academy Community School for Alternative Learners - Xenia, and Legacy Christian Academy.
Ownership History
Date
Name
Owned For
Owner Type
Purchase Details
Closed on
Mar 23, 2018
Sold by
Fallis Johnnie J and Fallis Heather M
Bought by
Capasso Luke T
Current Estimated Value
Home Financials for this Owner
Home Financials are based on the most recent Mortgage that was taken out on this home.
Original Mortgage
$41,610
Outstanding Balance
$35,673
Interest Rate
4.4%
Mortgage Type
New Conventional
Estimated Equity
$146,507
Purchase Details
Closed on
May 31, 2017
Sold by
Cole Michael D and Cole Cynthia L
Bought by
Falis Jay and Falis Heather M
Purchase Details
Closed on
Dec 15, 2012
Sold by
Stevenson Marianne and Hoffman Mizell Yvonne
Bought by
Cole Michael D and Cole Cynthia L
Purchase Details
Closed on
Apr 7, 2009
Sold by
Estate Of Louis A Ransom
Bought by
Ransom Ruth L and Ransom Ruth Lydia
Create a Home Valuation Report for This Property
The Home Valuation Report is an in-depth analysis detailing your home's value as well as a comparison with similar homes in the area
Home Values in the Area
Average Home Value in this Area
Purchase History
| Date | Buyer | Sale Price | Title Company |
|---|---|---|---|
| Capasso Luke T | $938,000 | None Available | |
| Falis Jay | -- | None Available | |
| Fallis Johnnie J | -- | None Available | |
| Cole Michael D | $40,000 | None Available | |
| Ransom Ruth L | -- | None Available |
Source: Public Records
Mortgage History
| Date | Status | Borrower | Loan Amount |
|---|---|---|---|
| Open | Capasso Luke T | $41,610 |
Source: Public Records
Tax History Compared to Growth
Tax History
| Year | Tax Paid | Tax Assessment Tax Assessment Total Assessment is a certain percentage of the fair market value that is determined by local assessors to be the total taxable value of land and additions on the property. | Land | Improvement |
|---|---|---|---|---|
| 2024 | $2,105 | $46,850 | $4,510 | $42,340 |
| 2023 | $2,005 | $46,850 | $4,510 | $42,340 |
| 2022 | $1,776 | $35,400 | $3,610 | $31,790 |
| 2021 | $1,800 | $35,400 | $3,610 | $31,790 |
| 2020 | $1,724 | $35,400 | $3,610 | $31,790 |
| 2019 | $1,419 | $27,430 | $3,200 | $24,230 |
| 2018 | $1,425 | $27,430 | $3,200 | $24,230 |
| 2017 | $1,443 | $27,430 | $3,200 | $24,230 |
| 2016 | $1,444 | $27,270 | $3,200 | $24,070 |
| 2015 | $724 | $27,270 | $3,200 | $24,070 |
| 2014 | $693 | $27,270 | $3,200 | $24,070 |
Source: Public Records
Map
Nearby Homes