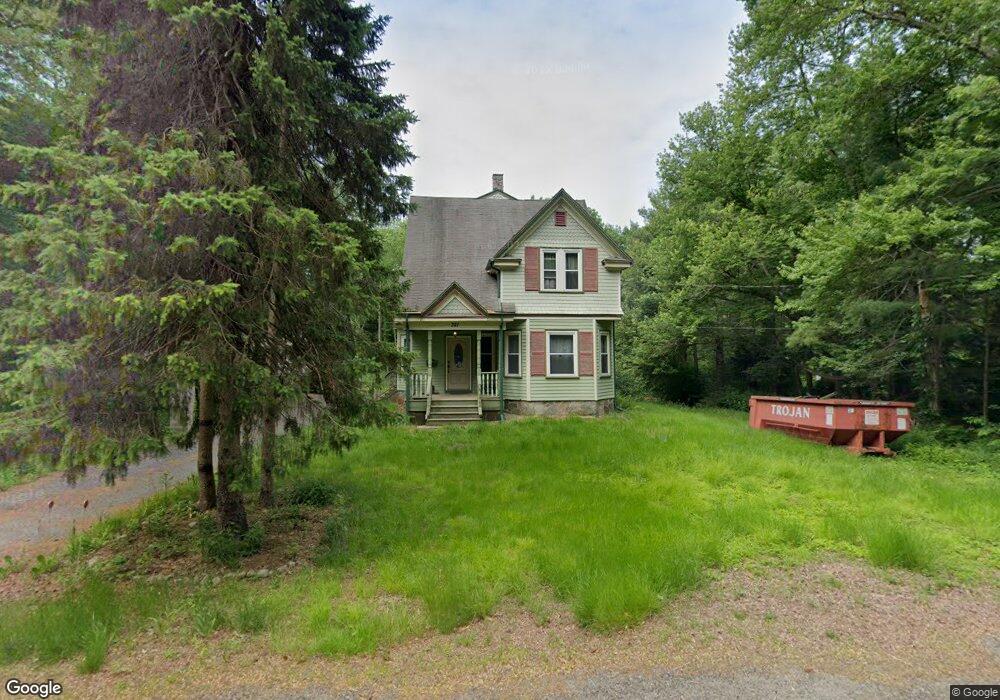
321 East St Brockton, MA 02302
Estimated Value: $554,000 - $828,000
4
Beds
3
Baths
2,736
Sq Ft
$246/Sq Ft
Est. Value
About This Home
This home is located at 321 East St, Brockton, MA 02302 and is currently estimated at $672,122, approximately $245 per square foot. 321 East St is a home located in Plymouth County with nearby schools including Davis K-8 School, John F. Kennedy Elementary School, and South Middle School.
Ownership History
Date
Name
Owned For
Owner Type
Purchase Details
Closed on
Sep 26, 2011
Sold by
Porter Robert
Bought by
Deloge Russell W and Carey Malcolm J
Current Estimated Value
Home Financials for this Owner
Home Financials are based on the most recent Mortgage that was taken out on this home.
Original Mortgage
$223,930
Outstanding Balance
$154,413
Interest Rate
4.33%
Mortgage Type
Purchase Money Mortgage
Estimated Equity
$517,709
Purchase Details
Closed on
Oct 14, 2010
Sold by
Smith Richard
Bought by
Porter Robert
Purchase Details
Closed on
Apr 11, 2001
Sold by
Spinney Lauraine and Reynolds Merrilyn
Bought by
Smith Richard
Create a Home Valuation Report for This Property
The Home Valuation Report is an in-depth analysis detailing your home's value as well as a comparison with similar homes in the area
Home Values in the Area
Average Home Value in this Area
Purchase History
| Date | Buyer | Sale Price | Title Company |
|---|---|---|---|
| Deloge Russell W | $279,900 | -- | |
| Porter Robert | $170,000 | -- | |
| Smith Richard | $195,000 | -- |
Source: Public Records
Mortgage History
| Date | Status | Borrower | Loan Amount |
|---|---|---|---|
| Open | Deloge Russell W | $223,930 | |
| Previous Owner | Smith Richard | $156,465 | |
| Previous Owner | Smith Richard | $453,000 |
Source: Public Records
Tax History Compared to Growth
Tax History
| Year | Tax Paid | Tax Assessment Tax Assessment Total Assessment is a certain percentage of the fair market value that is determined by local assessors to be the total taxable value of land and additions on the property. | Land | Improvement |
|---|---|---|---|---|
| 2025 | $6,521 | $538,500 | $293,600 | $244,900 |
| 2024 | $6,458 | $537,300 | $293,600 | $243,700 |
| 2023 | $6,777 | $522,100 | $263,700 | $258,400 |
| 2022 | $6,581 | $471,100 | $240,900 | $230,200 |
| 2021 | $5,709 | $393,700 | $170,400 | $223,300 |
| 2020 | $5,546 | $366,100 | $149,600 | $216,500 |
| 2019 | $5,865 | $377,400 | $139,300 | $238,100 |
| 2018 | $5,255 | $327,200 | $139,300 | $187,900 |
| 2017 | $5,075 | $315,200 | $139,300 | $175,900 |
| 2016 | $5,427 | $312,600 | $139,300 | $173,300 |
| 2015 | $4,763 | $262,400 | $139,300 | $123,100 |
| 2014 | $4,708 | $259,700 | $139,300 | $120,400 |
Source: Public Records
Map
Nearby Homes