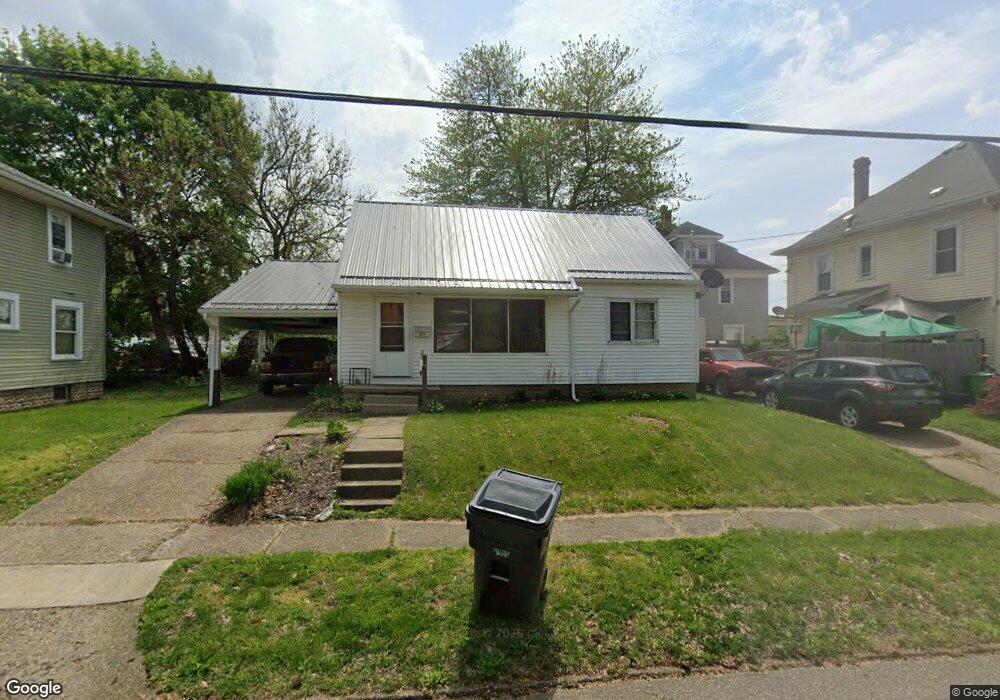
321 Elm St Coshocton, OH 43812
Estimated Value: $100,000 - $128,000
2
Beds
1
Bath
825
Sq Ft
$143/Sq Ft
Est. Value
About This Home
This home is located at 321 Elm St, Coshocton, OH 43812 and is currently estimated at $118,266, approximately $143 per square foot. 321 Elm St is a home located in Coshocton County with nearby schools including Coshocton High School, Coshocton Opportunity School, and Sacred Heart School.
Ownership History
Date
Name
Owned For
Owner Type
Purchase Details
Closed on
Jun 28, 2024
Sold by
Tuckwell Investments Llc
Bought by
Kjayco 2 Llc
Current Estimated Value
Purchase Details
Closed on
Aug 24, 2009
Sold by
Ker Investments Llc
Bought by
Tuckwell Investment Llc
Purchase Details
Closed on
May 29, 2003
Bought by
Ker Investments Llc
Purchase Details
Closed on
Mar 28, 2003
Sold by
Ferris Richard D
Bought by
Ker Investments Llc
Purchase Details
Closed on
Jan 22, 1996
Sold by
Norris James P
Bought by
Ferris Richard D
Create a Home Valuation Report for This Property
The Home Valuation Report is an in-depth analysis detailing your home's value as well as a comparison with similar homes in the area
Home Values in the Area
Average Home Value in this Area
Purchase History
| Date | Buyer | Sale Price | Title Company |
|---|---|---|---|
| Kjayco 2 Llc | $200,000 | First Ohio Title | |
| Kjayco 2 Llc | $200,000 | First Ohio Title | |
| Tuckwell Investment Llc | -- | None Available | |
| Ker Investments Llc | -- | -- | |
| Ker Investments Llc | -- | -- | |
| Ferris Richard D | $37,500 | -- |
Source: Public Records
Tax History
| Year | Tax Paid | Tax Assessment Tax Assessment Total Assessment is a certain percentage of the fair market value that is determined by local assessors to be the total taxable value of land and additions on the property. | Land | Improvement |
|---|---|---|---|---|
| 2024 | $689 | $16,300 | $2,670 | $13,630 |
| 2023 | $689 | $12,824 | $2,051 | $10,773 |
| 2022 | $346 | $12,824 | $2,051 | $10,773 |
| 2021 | $630 | $12,824 | $2,051 | $10,773 |
| 2020 | $597 | $11,750 | $1,999 | $9,751 |
| 2019 | $604 | $11,750 | $1,999 | $9,751 |
| 2018 | $600 | $11,750 | $1,999 | $9,751 |
| 2017 | $614 | $11,617 | $1,866 | $9,751 |
| 2016 | $590 | $11,617 | $1,866 | $9,751 |
| 2015 | $296 | $11,617 | $1,866 | $9,751 |
| 2014 | $664 | $13,983 | $2,485 | $11,498 |
Source: Public Records
Map
Nearby Homes
Your Personal Tour Guide
Ask me questions while you tour the home.