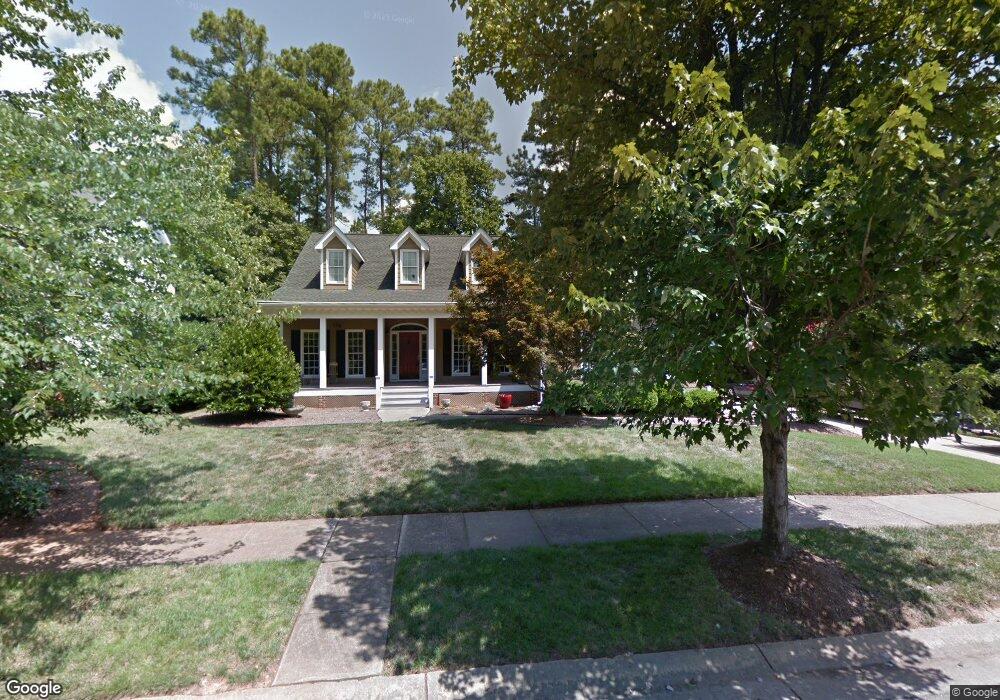
321 Flatrock Ln Holly Springs, NC 27540
Estimated Value: $567,000 - $779,000
3
Beds
2
Baths
2,104
Sq Ft
$318/Sq Ft
Est. Value
About This Home
This home is located at 321 Flatrock Ln, Holly Springs, NC 27540 and is currently estimated at $668,182, approximately $317 per square foot. 321 Flatrock Ln is a home located in Wake County with nearby schools including Holly Ridge Elementary School, Holly Ridge Middle School, and Holly Springs High School.
Ownership History
Date
Name
Owned For
Owner Type
Purchase Details
Closed on
Feb 22, 2005
Sold by
Estate Of David L Ayers and Anti Sarah Louise
Bought by
Karmire John Leefers and Karmire Theresa Lewis
Current Estimated Value
Home Financials for this Owner
Home Financials are based on the most recent Mortgage that was taken out on this home.
Original Mortgage
$224,800
Outstanding Balance
$116,136
Interest Rate
6%
Mortgage Type
Fannie Mae Freddie Mac
Estimated Equity
$552,046
Purchase Details
Closed on
May 18, 2001
Sold by
Vannest David and Vannest Kathy M
Bought by
Ayers David L and Ayers Cecelia A
Purchase Details
Closed on
Jul 29, 1999
Sold by
Helton Homes Inc
Bought by
Ayers David L and Ayers Cecelia A
Home Financials for this Owner
Home Financials are based on the most recent Mortgage that was taken out on this home.
Original Mortgage
$75,000
Interest Rate
7.28%
Create a Home Valuation Report for This Property
The Home Valuation Report is an in-depth analysis detailing your home's value as well as a comparison with similar homes in the area
Home Values in the Area
Average Home Value in this Area
Purchase History
| Date | Buyer | Sale Price | Title Company |
|---|---|---|---|
| Karmire John Leefers | $281,000 | -- | |
| Ayers David L | $8,000 | -- | |
| Ayers David L | $245,500 | -- |
Source: Public Records
Mortgage History
| Date | Status | Borrower | Loan Amount |
|---|---|---|---|
| Open | Karmire John Leefers | $224,800 | |
| Previous Owner | Ayers David L | $75,000 |
Source: Public Records
Tax History Compared to Growth
Tax History
| Year | Tax Paid | Tax Assessment Tax Assessment Total Assessment is a certain percentage of the fair market value that is determined by local assessors to be the total taxable value of land and additions on the property. | Land | Improvement |
|---|---|---|---|---|
| 2025 | $5,507 | $637,634 | $145,000 | $492,634 |
| 2024 | $5,485 | $637,634 | $145,000 | $492,634 |
| 2023 | $4,503 | $415,602 | $75,000 | $340,602 |
| 2022 | $4,347 | $415,602 | $75,000 | $340,602 |
| 2021 | $4,266 | $415,602 | $75,000 | $340,602 |
| 2020 | $4,266 | $415,602 | $75,000 | $340,602 |
| 2019 | $4,359 | $360,658 | $80,000 | $280,658 |
| 2018 | $3,668 | $335,606 | $80,000 | $255,606 |
| 2017 | $3,535 | $335,606 | $80,000 | $255,606 |
| 2016 | $3,487 | $335,606 | $80,000 | $255,606 |
| 2015 | $3,369 | $319,119 | $64,000 | $255,119 |
| 2014 | -- | $319,119 | $64,000 | $255,119 |
Source: Public Records
Map
Nearby Homes
- 0/416 Holly Springs Rd
- 5200 Gable Ridge Ln
- 137 Lacombe Ct
- 404 Prince Dr
- 504 Prince Dr
- 215 Savannah Ridge Rd Unit 215
- 109 Lacombe Ct
- 305 Savannah Ridge Rd
- 144 Holly Mountain Rd
- 4809 Greenpoint Ln
- 717 Bass Lake Rd
- 225 Old Ride Dr
- 208 Old Ride Dr
- 228 Masden Rd
- 112 Midden Way
- 204 Crossway Ln
- 705 Morton Farm Rd
- 217 Jones Hill Rd
- 413 Rhamkatte Rd
- 0 Old Ride Dr
- 325 Flatrock Ln
- 313 Flatrock Ln
- 329 Flatrock Ln
- 316 Flatrock Ln
- 312 Flatrock Ln
- 320 Flatrock Ln
- 309 Flatrock Ln
- 333 Flatrock Ln
- 308 Flatrock Ln
- 324 Flatrock Ln
- 305 Flatrock Ln
- 304 Flatrock Ln
- 337 Flatrock Ln
- 217 Norwalk St
- 213 Norwalk St
- 221 Norwalk St
- 328 Flatrock Ln
- 209 Norwalk St
- 301 Flatrock Ln
- 341 Flatrock Ln