Estimated Value: $108,000 - $158,000
3
Beds
1
Bath
1,092
Sq Ft
$126/Sq Ft
Est. Value
About This Home
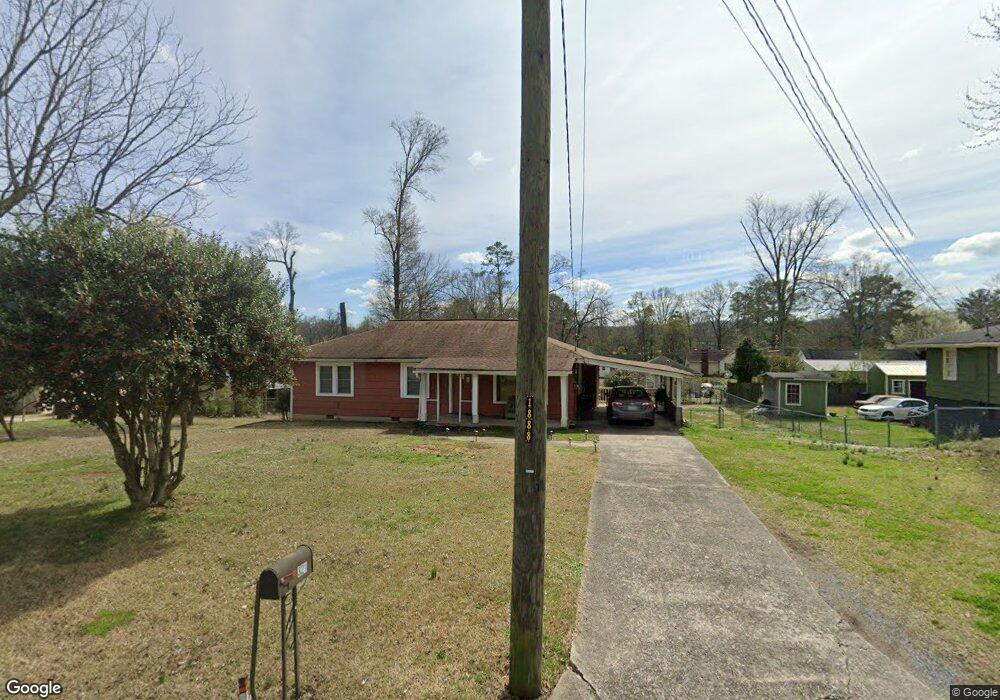
This home is located at 321 Greenwood Ave NW, Rome, GA 30165 and is currently estimated at $138,036, approximately $126 per square foot. 321 Greenwood Ave NW is a home located in Floyd County with nearby schools including Rome High School and St. Mary School.
Ownership History
Date
Name
Owned For
Owner Type
Purchase Details
Closed on
Nov 14, 2011
Sold by
Harris Donna E
Bought by
Rodriguez Rubisely
Current Estimated Value
Purchase Details
Closed on
Jul 9, 2001
Sold by
Johnson Belinda M and Harris Donna E
Bought by
Harris Donna E
Purchase Details
Closed on
Jun 7, 2001
Sold by
Lewis Walter H
Bought by
Johnson Belinda M and Harris Donna E
Purchase Details
Closed on
Oct 13, 1989
Sold by
Morrison John Andy
Bought by
Lewis Walter H
Purchase Details
Closed on
May 22, 1989
Sold by
Williams Martha A
Bought by
Morrison John Andy
Purchase Details
Closed on
Jul 4, 1988
Sold by
Morrison John A and Morrison Martha A
Bought by
Williams Martha A
Purchase Details
Closed on
Mar 5, 1982
Sold by
James Ruth N
Bought by
Morrison John A and Morrison Martha A
Purchase Details
Closed on
Aug 22, 1981
Sold by
James Geo L Est & Ruth
Bought by
James Ruth N
Purchase Details
Closed on
Jan 1, 1901
Bought by
James Geo L Est & Ruth
Create a Home Valuation Report for This Property
The Home Valuation Report is an in-depth analysis detailing your home's value as well as a comparison with similar homes in the area
Home Values in the Area
Average Home Value in this Area
Purchase History
| Date | Buyer | Sale Price | Title Company |
|---|---|---|---|
| Rodriguez Rubisely | $15,000 | -- | |
| Harris Donna E | $34,000 | -- | |
| Johnson Belinda M | -- | -- | |
| Lewis Walter H | $30,000 | -- | |
| Morrison John Andy | $22,800 | -- | |
| Williams Martha A | -- | -- | |
| Morrison John A | $30,000 | -- | |
| James Ruth N | -- | -- | |
| James Geo L Est & Ruth | -- | -- |
Source: Public Records
Tax History Compared to Growth
Tax History
| Year | Tax Paid | Tax Assessment Tax Assessment Total Assessment is a certain percentage of the fair market value that is determined by local assessors to be the total taxable value of land and additions on the property. | Land | Improvement |
|---|---|---|---|---|
| 2024 | $1,204 | $46,737 | $11,405 | $35,332 |
| 2023 | $960 | $32,816 | $10,138 | $22,678 |
| 2022 | $954 | $30,528 | $8,448 | $22,080 |
| 2021 | $930 | $28,248 | $8,448 | $19,800 |
| 2020 | $879 | $24,976 | $6,336 | $18,640 |
| 2019 | $835 | $23,836 | $6,336 | $17,500 |
| 2018 | $852 | $24,310 | $6,336 | $17,974 |
| 2017 | $825 | $23,562 | $6,336 | $17,226 |
| 2016 | $869 | $24,680 | $6,320 | $18,360 |
| 2015 | $834 | $24,680 | $6,320 | $18,360 |
| 2014 | $834 | $23,780 | $6,320 | $17,460 |
Source: Public Records
Map
Nearby Homes
- 319 Greenwood Ave NW
- 323 Greenwood Ave NW
- 320 Edgewood Ave NW
- 322 Edgewood Ave NW
- 318 Edgewood Ave NW
- 324 Edgewood Ave NW
- 320 Greenwood Ave NW
- 318 Greenwood Ave NW
- 317 Greenwood Ave NW
- 322 Greenwood Ave NW
- 316 Edgewood Ave NW
- 0 Edgewood Ave NW Unit 7071586
- 0 Edgewood Ave NW Unit 8362946
- 0 Edgewood Ave NW Unit 7347898
- 0 Edgewood Ave NW Unit 3234984
- 0 Edgewood Ave NW Unit 3060372
- 316 Greenwood Ave NW
- 303 Dellwood Dr NW
- 301 Dellwood Dr NW
- 305 Dellwood Dr NW