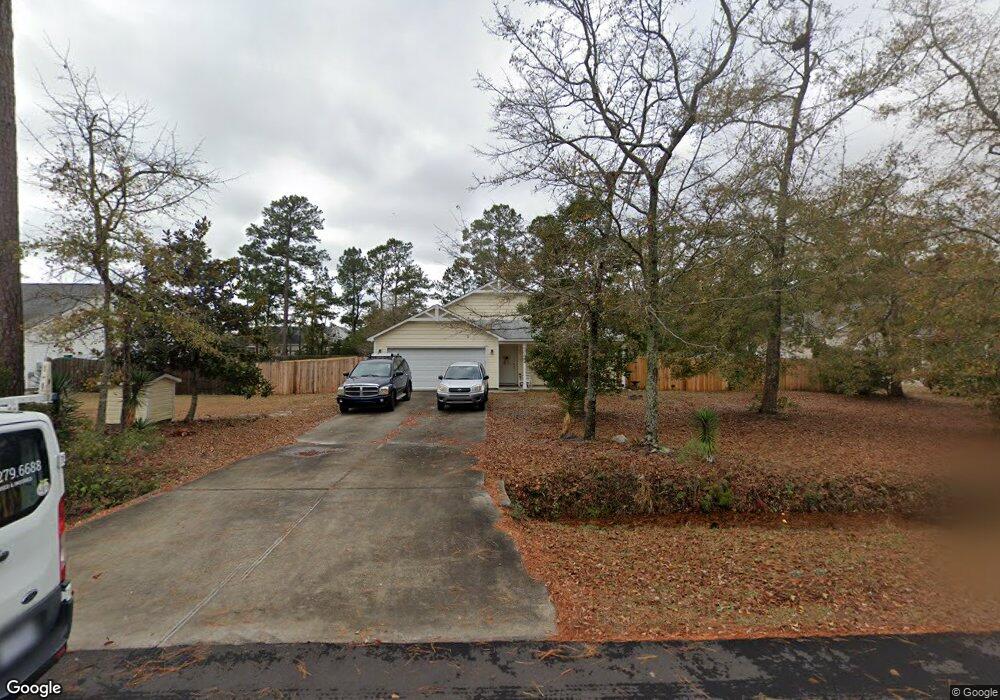
321 Kemper Rd Hampstead, NC 28443
Estimated Value: $378,513 - $417,000
3
Beds
2
Baths
1,504
Sq Ft
$265/Sq Ft
Est. Value
About This Home
This home is located at 321 Kemper Rd, Hampstead, NC 28443 and is currently estimated at $398,128, approximately $264 per square foot. 321 Kemper Rd is a home located in Pender County with nearby schools including North Topsail Elementary School, Topsail Middle School, and Topsail High School.
Ownership History
Date
Name
Owned For
Owner Type
Purchase Details
Closed on
Jun 29, 2010
Sold by
Mosley James and Mosley Alysia
Bought by
Roman Jose and Roman Crystal
Current Estimated Value
Home Financials for this Owner
Home Financials are based on the most recent Mortgage that was taken out on this home.
Original Mortgage
$158,150
Outstanding Balance
$103,298
Interest Rate
4.77%
Mortgage Type
New Conventional
Estimated Equity
$294,830
Purchase Details
Closed on
Jun 3, 2010
Sold by
Moseley James and Moseley Alysia
Bought by
Moseley James and Randall James M
Home Financials for this Owner
Home Financials are based on the most recent Mortgage that was taken out on this home.
Original Mortgage
$158,150
Outstanding Balance
$103,298
Interest Rate
4.77%
Mortgage Type
New Conventional
Estimated Equity
$294,830
Purchase Details
Closed on
Sep 24, 2007
Sold by
Kye Kenneth L and Kye Wanda G
Bought by
Moseley James
Create a Home Valuation Report for This Property
The Home Valuation Report is an in-depth analysis detailing your home's value as well as a comparison with similar homes in the area
Home Values in the Area
Average Home Value in this Area
Purchase History
| Date | Buyer | Sale Price | Title Company |
|---|---|---|---|
| Roman Jose | $171,500 | -- | |
| Moseley James | -- | -- | |
| Moseley James | $50,000 | -- |
Source: Public Records
Mortgage History
| Date | Status | Borrower | Loan Amount |
|---|---|---|---|
| Open | Roman Jose | $158,150 |
Source: Public Records
Tax History
| Year | Tax Paid | Tax Assessment Tax Assessment Total Assessment is a certain percentage of the fair market value that is determined by local assessors to be the total taxable value of land and additions on the property. | Land | Improvement |
|---|---|---|---|---|
| 2025 | $2,261 | $310,366 | $58,055 | $252,311 |
| 2024 | $2,261 | $222,860 | $51,929 | $170,931 |
| 2023 | $2,261 | $222,860 | $51,929 | $170,931 |
| 2022 | $2,075 | $222,860 | $51,929 | $170,931 |
| 2021 | $2,075 | $222,860 | $51,929 | $170,931 |
| 2020 | $2,075 | $222,860 | $51,929 | $170,931 |
| 2019 | $2,075 | $222,860 | $51,929 | $170,931 |
| 2018 | $1,715 | $171,342 | $40,000 | $131,342 |
| 2017 | $1,715 | $171,342 | $40,000 | $131,342 |
| 2016 | $1,698 | $171,342 | $40,000 | $131,342 |
| 2015 | -- | $171,342 | $40,000 | $131,342 |
| 2014 | $1,320 | $171,342 | $40,000 | $131,342 |
| 2013 | -- | $171,342 | $40,000 | $131,342 |
| 2012 | -- | $171,342 | $40,000 | $131,342 |
Source: Public Records
Map
Nearby Homes
- 11 E Bailey Ln
- 0000 Sloop Point Loop Rd
- 100 Lindy Ct
- 54 Strawberry Fields Way
- 108 Doral Dr
- Lot 2 Doral Dr
- 107 Wild Berry Ln
- 505 W Craftsman Way
- 618 W Craftsman Way
- 46 E Cloverfield Ln
- 105 N Lamplighters Walk
- 118 Sailor Sky Way
- 35 W Cloverfield Ln
- 142 Sailor Sky Way
- 170 N Passerine Path
- 108 S Lamplighters Walk
- 80 Radiance Way
- 296 Aurora Place
- 100 Yacht Basin Landing
- 46 N Radiance Way
Your Personal Tour Guide
Ask me questions while you tour the home.