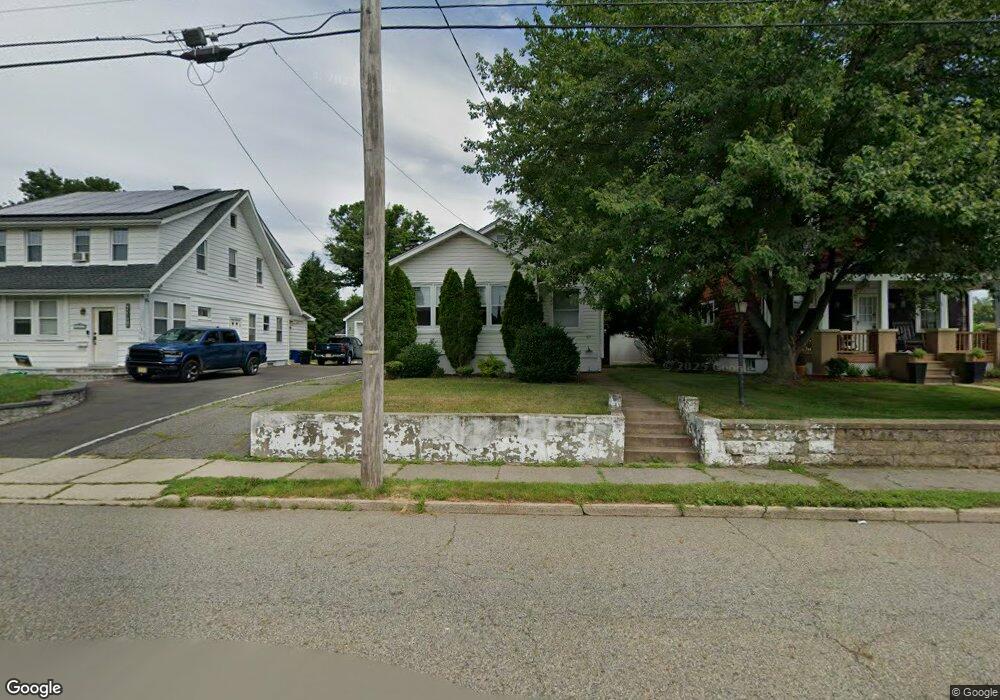
321 Lakeside Ave Pompton Lakes, NJ 07442
Estimated Value: $432,000 - $575,000
Studio
--
Bath
984
Sq Ft
$494/Sq Ft
Est. Value
About This Home
This home is located at 321 Lakeside Ave, Pompton Lakes, NJ 07442 and is currently estimated at $485,798, approximately $493 per square foot. 321 Lakeside Ave is a home located in Passaic County with nearby schools including Pompton Lakes High School, St Marys School, and Apple Montessori School of Oakland.
Ownership History
Date
Name
Owned For
Owner Type
Purchase Details
Closed on
Jun 21, 2019
Sold by
Robertson Gordon A and Robertson Lauren M
Bought by
Robertson Lauren M
Current Estimated Value
Purchase Details
Closed on
May 9, 2008
Sold by
Dellay Alfreda
Bought by
Robertson Gordon A and Robertson Lauren M
Home Financials for this Owner
Home Financials are based on the most recent Mortgage that was taken out on this home.
Original Mortgage
$293,900
Outstanding Balance
$186,709
Interest Rate
5.94%
Mortgage Type
New Conventional
Estimated Equity
$299,089
Create a Home Valuation Report for This Property
The Home Valuation Report is an in-depth analysis detailing your home's value as well as a comparison with similar homes in the area
Home Values in the Area
Average Home Value in this Area
Purchase History
| Date | Buyer | Sale Price | Title Company |
|---|---|---|---|
| Robertson Lauren M | -- | Stewart Title Guaranty Co | |
| Robertson Gordon A | $303,000 | -- |
Source: Public Records
Mortgage History
| Date | Status | Borrower | Loan Amount |
|---|---|---|---|
| Open | Robertson Gordon A | $293,900 |
Source: Public Records
Tax History
| Year | Tax Paid | Tax Assessment Tax Assessment Total Assessment is a certain percentage of the fair market value that is determined by local assessors to be the total taxable value of land and additions on the property. | Land | Improvement |
|---|---|---|---|---|
| 2025 | $9,436 | $239,300 | $138,400 | $100,900 |
| 2024 | $9,177 | $239,300 | $138,400 | $100,900 |
Source: Public Records
Map
Nearby Homes
- 238 Van Ave
- 421 Lincoln Ave
- 32 Walnut St
- 136 Mountainside Dr
- 68 Mountainside Dr
- 46 Barbara Dr
- 26 James Terrace
- 185 Summit Ave
- 246 Ridge Dr
- 434 Ringwood Ave
- 770 Ringwood Ave
- 20 Circle Ave
- 124 Ridge Dr
- 112 Park Place
- 1123 Pines Lake Dr W
- 25 Morris Ave
- 120 Hershfield St
- 120 Willard St Unit 16
- 7 Colona Rd
- 100 Pierson Miller Dr Unit 4