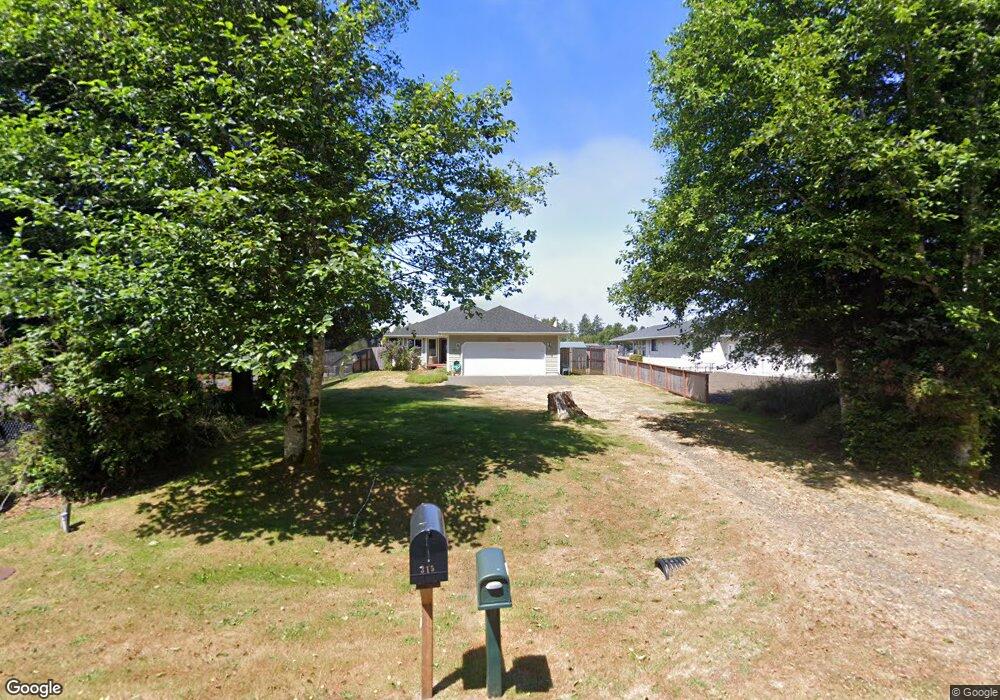
321 Lakeview Loop NE Ocean Shores, WA 98569
Estimated Value: $487,000 - $628,000
2
Beds
2
Baths
1,835
Sq Ft
$295/Sq Ft
Est. Value
About This Home
This home is located at 321 Lakeview Loop NE, Ocean Shores, WA 98569 and is currently estimated at $540,420, approximately $294 per square foot. 321 Lakeview Loop NE is a home located in Grays Harbor County with nearby schools including North Beach Junior/Senior High School.
Ownership History
Date
Name
Owned For
Owner Type
Purchase Details
Closed on
Dec 8, 2009
Sold by
Mceachin Richard and Mceachin Colleen
Bought by
Enghusen Jack W and Enghusen Barbara
Current Estimated Value
Home Financials for this Owner
Home Financials are based on the most recent Mortgage that was taken out on this home.
Original Mortgage
$185,000
Outstanding Balance
$117,344
Interest Rate
4.37%
Mortgage Type
New Conventional
Estimated Equity
$423,076
Create a Home Valuation Report for This Property
The Home Valuation Report is an in-depth analysis detailing your home's value as well as a comparison with similar homes in the area
Home Values in the Area
Average Home Value in this Area
Purchase History
| Date | Buyer | Sale Price | Title Company |
|---|---|---|---|
| Enghusen Jack W | $234,967 | Grays Harbor Title |
Source: Public Records
Mortgage History
| Date | Status | Borrower | Loan Amount |
|---|---|---|---|
| Open | Enghusen Jack W | $185,000 |
Source: Public Records
Tax History Compared to Growth
Tax History
| Year | Tax Paid | Tax Assessment Tax Assessment Total Assessment is a certain percentage of the fair market value that is determined by local assessors to be the total taxable value of land and additions on the property. | Land | Improvement |
|---|---|---|---|---|
| 2025 | $3,314 | $523,327 | $130,000 | $393,327 |
| 2023 | $3,289 | $491,140 | $140,140 | $351,000 |
| 2022 | $3,216 | $380,521 | $112,125 | $268,396 |
| 2021 | $3,384 | $380,521 | $112,125 | $268,396 |
| 2020 | $3,223 | $327,712 | $97,500 | $230,212 |
| 2019 | $3,010 | $300,400 | $81,250 | $219,150 |
| 2018 | $3,138 | $273,260 | $65,000 | $208,260 |
| 2017 | $2,617 | $262,922 | $65,000 | $197,922 |
| 2016 | $2,545 | $219,770 | $66,000 | $153,770 |
| 2014 | -- | $222,480 | $56,000 | $166,480 |
| 2013 | -- | $243,525 | $70,000 | $173,525 |
Source: Public Records
Map
Nearby Homes
- 337 Hyde Ct NE
- 314 Lakeview Loop NE
- 308 Lakeview Loop NE
- 336 Hyde Ct NE
- 341 Duck Lake Dr NE
- 360 Lakeview Loop NE
- 366 Lakeview Loop NE
- 359 Duck Lake Dr NE
- 318 Duck Lake Dr NE
- 0 Smith Ave Unit PI25190316
- 284 Duck Lake Dr NE
- 301 Olympic View Ave NE
- 387 Duck Lake Dr NE
- 394 Lakeview Loop NE
- 242 Duck Lake Dr NE
- 254 Olympic View Ave NE
- 232 Fisher Ave NE
- 413 Lakeview Loop NE
- 229 Olympic View Ave NE
- 223 Olympic View Ave NE
- 315 Lake View Loop NE
- 325 Lakeview Loop NE
- 315 Lakeview Loop NE
- 331 Lakeview Loop NE
- 305 Lakeview Loop NE
- 320 Lakeview Loop NE
- 326 Lakeview Loop NE
- 341 Lakeview Loop NE
- 301 Lakeview Loop NE
- 335 Hyde Ct NE
- 302 Corning Ct NE
- 302 Corning St
- 299 Lakeview Loop NE
- 296 Corning St
- 300 Lake View Lp NE
- 339 Hyde Ct NE
- 351 Lakeview Loop NE
- 295 Lakeview Loop NE
- 304 Corning St