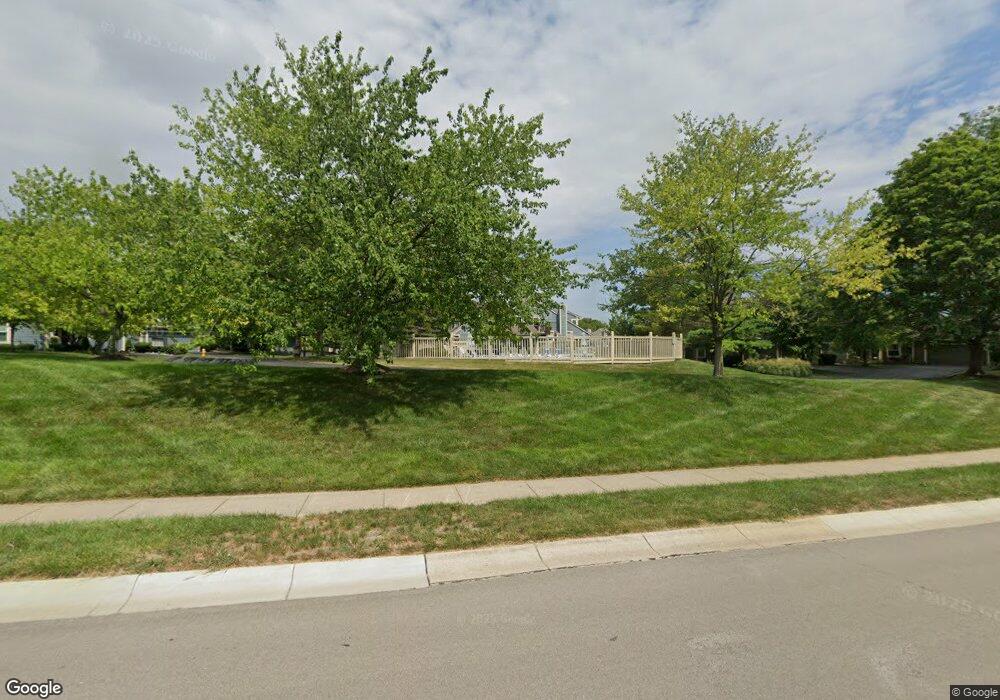
321 Lobster Tail Ct Unit 36173 Dayton, OH 45458
Estimated Value: $162,527 - $174,000
2
Beds
2
Baths
933
Sq Ft
$181/Sq Ft
Est. Value
About This Home
This home is located at 321 Lobster Tail Ct Unit 36173, Dayton, OH 45458 and is currently estimated at $168,632, approximately $180 per square foot. 321 Lobster Tail Ct Unit 36173 is a home located in Montgomery County with nearby schools including Primary Village South, Weller Elementary School, and Magsig Middle School.
Ownership History
Date
Name
Owned For
Owner Type
Purchase Details
Closed on
Feb 13, 2008
Sold by
Ohare Timothy A
Bought by
Williams Tricia
Current Estimated Value
Home Financials for this Owner
Home Financials are based on the most recent Mortgage that was taken out on this home.
Original Mortgage
$99,750
Outstanding Balance
$61,892
Interest Rate
5.75%
Mortgage Type
Purchase Money Mortgage
Estimated Equity
$106,740
Purchase Details
Closed on
Jul 15, 1997
Sold by
Macleod Stephen S
Bought by
Ohare Timothy A
Create a Home Valuation Report for This Property
The Home Valuation Report is an in-depth analysis detailing your home's value as well as a comparison with similar homes in the area
Home Values in the Area
Average Home Value in this Area
Purchase History
| Date | Buyer | Sale Price | Title Company |
|---|---|---|---|
| Williams Tricia | $105,000 | Attorney | |
| Ohare Timothy A | $78,500 | -- |
Source: Public Records
Mortgage History
| Date | Status | Borrower | Loan Amount |
|---|---|---|---|
| Open | Williams Tricia | $99,750 |
Source: Public Records
Tax History Compared to Growth
Tax History
| Year | Tax Paid | Tax Assessment Tax Assessment Total Assessment is a certain percentage of the fair market value that is determined by local assessors to be the total taxable value of land and additions on the property. | Land | Improvement |
|---|---|---|---|---|
| 2024 | $2,949 | $47,660 | $7,460 | $40,200 |
| 2023 | $2,949 | $47,660 | $7,460 | $40,200 |
| 2022 | $2,746 | $35,090 | $5,480 | $29,610 |
| 2021 | $2,753 | $35,090 | $5,480 | $29,610 |
| 2020 | $2,749 | $35,090 | $5,480 | $29,610 |
| 2019 | $2,587 | $29,490 | $5,480 | $24,010 |
| 2018 | $2,312 | $29,490 | $5,480 | $24,010 |
| 2017 | $2,287 | $29,490 | $5,480 | $24,010 |
| 2016 | $2,266 | $27,530 | $5,480 | $22,050 |
| 2015 | $2,229 | $27,530 | $5,480 | $22,050 |
| 2014 | $2,229 | $27,530 | $5,480 | $22,050 |
| 2012 | -- | $32,030 | $5,480 | $26,550 |
Source: Public Records
Map
Nearby Homes
- 154 Queens Crossing Unit 31152
- 240 Queens Crossing Unit 23121
- 9652 Belfry Ct Unit 29652
- 9648 Whalers Wharf Unit 1251
- 9618 Whalers Wharf Unit 833
- 30 Edinburgh Village Dr Unit 530
- 300 Grassy Creek Way
- 9971 Stonemeade Way
- 184 Edinburgh Village Dr Unit 13184
- 207 Hibberd Dr
- 10055 Mallet Dr
- 0 Yankee St Unit 934084
- 9230 Bottega South Dr Unit 38
- 9215 Bottega South Dr Unit 66
- 9197 Remy Ct
- 9161 Remy
- 118 Marco Ln Unit E17
- 95 Marco Ln Unit B6
- 9452 Sugar Bend Trail
- 9476 Sheehan Rd
- 325 Lobster Tail Ct Unit 36175
- 323 Lobster Tail Ct Unit 36174
- 327 Lobster Tail Ct Unit 176
- 327 Lobster Tail Ct Unit 36176
- 161 Queens Crossing Unit 35172
- 165 Queens Crossing Unit 35170
- 165 Queens Crossing Unit 170
- 266 Queens Crossing Unit 21109
- 266 Queens Crossing
- 167 Queens Crossing Unit 35169
- 248 Queens Crossing Unit 22118
- 225 Queens Crossing Unit 1989C
- 262 Queens Crossing Unit 21111
- 226 Queens Crossing Unit 24125
- 228 Queens Crossing Unit 24124
- 104 Queens Crossing Unit 26134
- 226 Queens Crossing Unit 125
- 264 Queens Crossing Unit 21110
- 260 Queens Crossing Unit 21112
- 242 Queens Crossing Unit 23120
