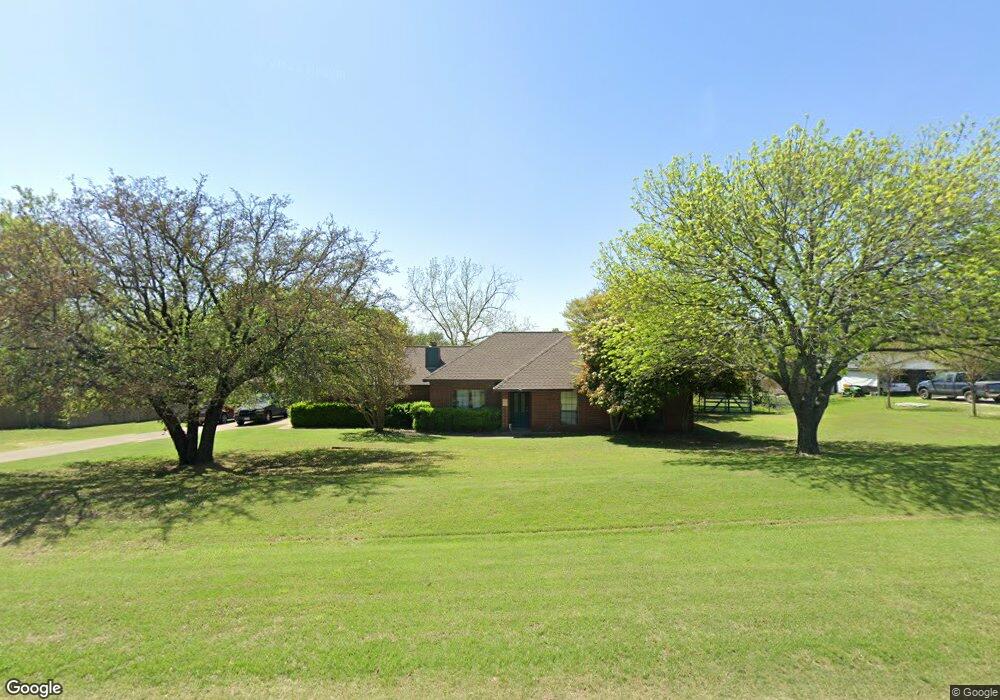
321 Lonquist Rd Midlothian, TX 76065
Estimated Value: $353,609 - $356,000
3
Beds
3
Baths
1,842
Sq Ft
$193/Sq Ft
Est. Value
About This Home
This home is located at 321 Lonquist Rd, Midlothian, TX 76065 and is currently estimated at $354,805, approximately $192 per square foot. 321 Lonquist Rd is a home located in Ellis County with nearby schools including T E Baxter Elementary School and Walnut Grove Middle School.
Ownership History
Date
Name
Owned For
Owner Type
Purchase Details
Closed on
Aug 2, 2022
Sold by
Evans Candida M
Bought by
Evans Candida M and Evans Amber
Current Estimated Value
Home Financials for this Owner
Home Financials are based on the most recent Mortgage that was taken out on this home.
Original Mortgage
$182,129
Outstanding Balance
$174,531
Interest Rate
5.81%
Mortgage Type
FHA
Estimated Equity
$180,274
Purchase Details
Closed on
Jul 1, 2022
Sold by
Jason Evans
Bought by
Evans Candida M
Home Financials for this Owner
Home Financials are based on the most recent Mortgage that was taken out on this home.
Original Mortgage
$182,129
Outstanding Balance
$174,531
Interest Rate
5.81%
Mortgage Type
FHA
Estimated Equity
$180,274
Create a Home Valuation Report for This Property
The Home Valuation Report is an in-depth analysis detailing your home's value as well as a comparison with similar homes in the area
Home Values in the Area
Average Home Value in this Area
Purchase History
| Date | Buyer | Sale Price | Title Company |
|---|---|---|---|
| Evans Candida M | -- | Fuigham Law Firm Pc | |
| Evans Candida M | $90,000 | Fulgham Law Firm Pc |
Source: Public Records
Mortgage History
| Date | Status | Borrower | Loan Amount |
|---|---|---|---|
| Open | Evans Candida M | $182,129 | |
| Closed | Evans Candida M | $90,000 |
Source: Public Records
Tax History Compared to Growth
Tax History
| Year | Tax Paid | Tax Assessment Tax Assessment Total Assessment is a certain percentage of the fair market value that is determined by local assessors to be the total taxable value of land and additions on the property. | Land | Improvement |
|---|---|---|---|---|
| 2025 | $3,677 | $304,974 | -- | -- |
| 2024 | $3,677 | $277,249 | -- | -- |
| 2023 | $3,677 | $252,045 | $0 | $0 |
| 2022 | $5,134 | $229,132 | $0 | $0 |
| 2021 | $4,929 | $226,110 | $39,380 | $186,730 |
| 2020 | $4,764 | $202,780 | $37,500 | $165,280 |
| 2019 | $4,508 | $172,150 | $0 | $0 |
| 2018 | $3,594 | $162,220 | $30,000 | $132,220 |
| 2017 | $4,238 | $159,230 | $30,000 | $129,230 |
| 2016 | $3,858 | $144,930 | $30,000 | $114,930 |
| 2015 | $3,088 | $136,380 | $30,000 | $106,380 |
| 2014 | $3,088 | $133,210 | $0 | $0 |
Source: Public Records
Map
Nearby Homes
- 111 Kirk Rd
- 4210 Tea Olive Dr
- 4821 Azalea Way
- Lot 2 Tbd Ln
- Lot 3 Tbd Ln
- Lot 5 Tbd Ln
- 2814 Livestock Dr
- 2818 Livestock Dr
- 2830 Livestock Dr
- 2841 Livestock Dr
- 2825 Livestock Dr
- 2834 Livestock Dr
- 2845 Livestock Dr
- 2838 Livestock Dr
- 2846 Livestock Dr
- 2 Saint Charles Place
- 800 Short Line Blvd
- 112 Boardwalk St
- 2123 Plan at Redden Farms - Signature
- 2370 Plan at Redden Farms - Signature