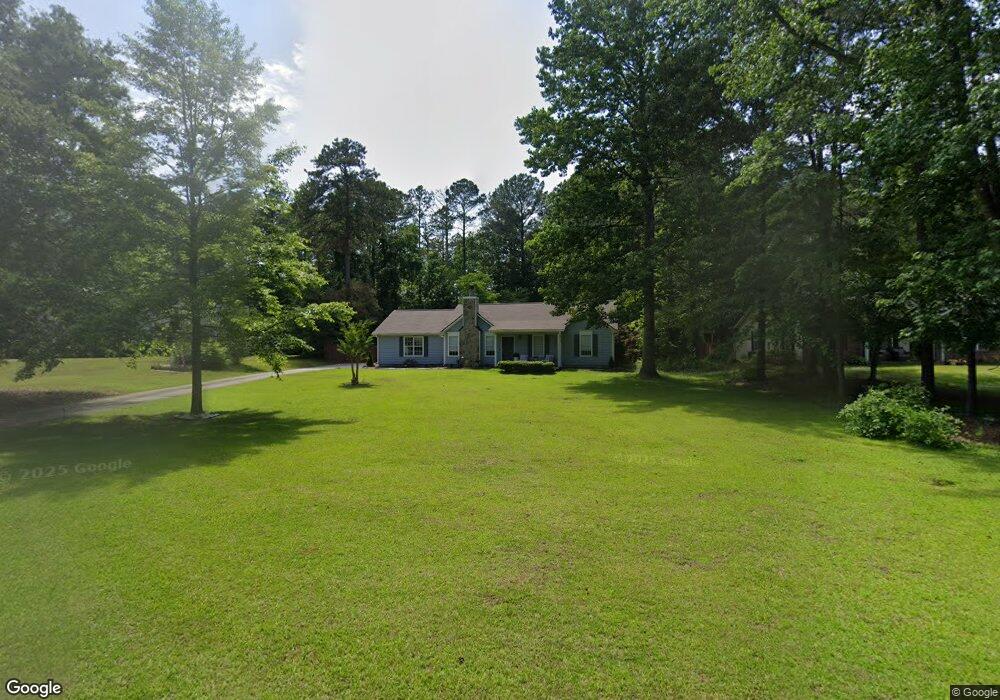
321 Marsha Way Sharpsburg, GA 30277
Estimated Value: $309,064 - $329,000
3
Beds
2
Baths
1,620
Sq Ft
$197/Sq Ft
Est. Value
About This Home
This home is located at 321 Marsha Way, Sharpsburg, GA 30277 and is currently estimated at $319,516, approximately $197 per square foot. 321 Marsha Way is a home located in Coweta County with nearby schools including Poplar Road Elementary School, East Coweta Middle School, and East Coweta High School.
Ownership History
Date
Name
Owned For
Owner Type
Purchase Details
Closed on
Feb 28, 2006
Sold by
Story Mitchell T
Bought by
Marlowe Dennis A and Marlowe Tammy J
Current Estimated Value
Home Financials for this Owner
Home Financials are based on the most recent Mortgage that was taken out on this home.
Original Mortgage
$127,120
Outstanding Balance
$74,004
Interest Rate
6.88%
Mortgage Type
New Conventional
Estimated Equity
$245,512
Purchase Details
Closed on
Aug 30, 2002
Sold by
Willms Anne C
Bought by
Story Mitchell T
Home Financials for this Owner
Home Financials are based on the most recent Mortgage that was taken out on this home.
Original Mortgage
$134,000
Interest Rate
6.4%
Mortgage Type
New Conventional
Purchase Details
Closed on
Apr 29, 1994
Sold by
Lindsey Homes
Bought by
Williams Anne
Home Financials for this Owner
Home Financials are based on the most recent Mortgage that was taken out on this home.
Original Mortgage
$80,150
Interest Rate
5%
Mortgage Type
Purchase Money Mortgage
Purchase Details
Closed on
Feb 24, 1994
Bought by
David Lindsey Homes
Purchase Details
Closed on
May 27, 1993
Bought by
Webster Reese Homes
Create a Home Valuation Report for This Property
The Home Valuation Report is an in-depth analysis detailing your home's value as well as a comparison with similar homes in the area
Home Values in the Area
Average Home Value in this Area
Purchase History
| Date | Buyer | Sale Price | Title Company |
|---|---|---|---|
| Marlowe Dennis A | $158,900 | -- | |
| Story Mitchell T | $134,000 | -- | |
| Williams Anne | $89,100 | -- | |
| David Lindsey Homes | $101,500 | -- | |
| Webster Reese Homes | $480,100 | -- |
Source: Public Records
Mortgage History
| Date | Status | Borrower | Loan Amount |
|---|---|---|---|
| Open | Marlowe Dennis A | $127,120 | |
| Previous Owner | Story Mitchell T | $134,000 | |
| Previous Owner | Williams Anne | $80,150 |
Source: Public Records
Tax History Compared to Growth
Tax History
| Year | Tax Paid | Tax Assessment Tax Assessment Total Assessment is a certain percentage of the fair market value that is determined by local assessors to be the total taxable value of land and additions on the property. | Land | Improvement |
|---|---|---|---|---|
| 2025 | $2,430 | $110,486 | $26,000 | $84,486 |
| 2024 | $2,282 | $102,891 | $26,000 | $76,891 |
| 2023 | $2,282 | $107,616 | $24,000 | $83,616 |
| 2022 | $2,027 | $86,985 | $20,000 | $66,985 |
| 2021 | $1,758 | $71,436 | $16,000 | $55,436 |
| 2020 | $1,768 | $71,436 | $16,000 | $55,436 |
| 2019 | $1,687 | $62,434 | $10,000 | $52,434 |
| 2018 | $1,690 | $62,434 | $10,000 | $52,434 |
| 2017 | $1,527 | $56,868 | $10,000 | $46,868 |
| 2016 | $1,510 | $56,868 | $10,000 | $46,868 |
| 2015 | $1,329 | $51,302 | $10,000 | $41,302 |
| 2014 | $1,164 | $45,736 | $10,000 | $35,736 |
Source: Public Records
Map
Nearby Homes
- 140 Halo Trace
- 138 Main St
- 46 Lullwater Ct
- 68 Winchester Dr
- 565 Timberbrook Dr
- 1 Mcintosh Trail
- 0 Bob Smith Rd Unit 10562838
- 196 Bob Smith Rd
- 250 Bob Smith Rd
- 0 Highway 154 Unit 10470800
- 180 Saint James Place
- 49 Durham Estates Dr
- 316 Winchester Dr
- 65 Oakhurst Trail
- 69 Oakhurst Trail
- 25 Chemin Place
- 296 Mcintosh Trail
- 25 Lentry Dr
- 165 Durham Estates Dr
- 270 Sturgess Run
- 309 Marsha Way
- 339 Marsha Way
- 305 Marsha Way
- 305 Marsha Way Unit N/
- 310 Old Highway 16
- 341 Marsha Way
- 322 Marsha Way
- 348 Marsha Way
- 312 Marsha Way
- 295 Marsha Way
- 347 Marsha Way
- 276 Old Highway 16
- 353 Marsha Way Unit 38
- 353 Marsha Way
- 290 Old Highway 16
- 330 Old Highway 16
- 289 Marsha Way
- 278 Marsha Way
- 300 Old Highway 16
- 340 Old Highway 16