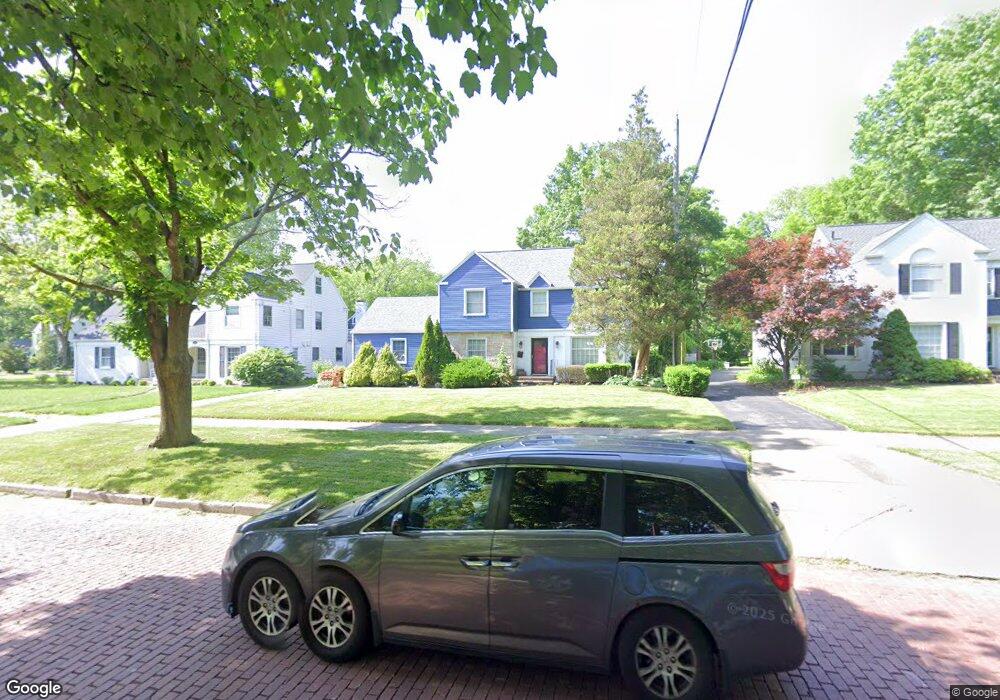
321 Mull Ave Akron, OH 44313
West Akron NeighborhoodEstimated Value: $252,235 - $262,000
3
Beds
2
Baths
1,710
Sq Ft
$150/Sq Ft
Est. Value
About This Home
This home is located at 321 Mull Ave, Akron, OH 44313 and is currently estimated at $257,059, approximately $150 per square foot. 321 Mull Ave is a home located in Summit County with nearby schools including Case Community Learning Center, Summit Academy School, and Our Lady Of The Elms Elementary School.
Ownership History
Date
Name
Owned For
Owner Type
Purchase Details
Closed on
May 13, 2021
Sold by
Walk Matthew S
Bought by
Next To Kin Supportive Services Llc
Current Estimated Value
Purchase Details
Closed on
Oct 23, 2007
Sold by
Walk Matthew S and Adams Lesley A
Bought by
Walk Matthew S
Home Financials for this Owner
Home Financials are based on the most recent Mortgage that was taken out on this home.
Original Mortgage
$130,400
Interest Rate
6.44%
Mortgage Type
New Conventional
Purchase Details
Closed on
Aug 11, 2005
Sold by
Mohler Marian S
Bought by
Walk Matthew S and Adams Lesley A
Home Financials for this Owner
Home Financials are based on the most recent Mortgage that was taken out on this home.
Original Mortgage
$124,000
Interest Rate
5.82%
Mortgage Type
Fannie Mae Freddie Mac
Create a Home Valuation Report for This Property
The Home Valuation Report is an in-depth analysis detailing your home's value as well as a comparison with similar homes in the area
Home Values in the Area
Average Home Value in this Area
Purchase History
| Date | Buyer | Sale Price | Title Company |
|---|---|---|---|
| Next To Kin Supportive Services Llc | $171,000 | None Available | |
| Walk Matthew S | $73,350 | Buckeye Reserve Title | |
| Walk Matthew S | $155,000 | Approved Statewide Title |
Source: Public Records
Mortgage History
| Date | Status | Borrower | Loan Amount |
|---|---|---|---|
| Previous Owner | Walk Matthew S | $130,400 | |
| Previous Owner | Walk Matthew S | $124,000 | |
| Closed | Walk Matthew S | $31,000 |
Source: Public Records
Tax History
| Year | Tax Paid | Tax Assessment Tax Assessment Total Assessment is a certain percentage of the fair market value that is determined by local assessors to be the total taxable value of land and additions on the property. | Land | Improvement |
|---|---|---|---|---|
| 2024 | $4,036 | $71,807 | $15,726 | $56,081 |
| 2023 | $4,243 | $71,807 | $15,726 | $56,081 |
| 2022 | $3,691 | $51,290 | $11,232 | $40,058 |
| 2021 | $3,555 | $50,705 | $11,232 | $39,473 |
| 2020 | $3,503 | $50,700 | $11,230 | $39,470 |
| 2019 | $3,603 | $47,450 | $11,230 | $36,220 |
| 2018 | $3,556 | $47,450 | $11,230 | $36,220 |
| 2017 | $3,317 | $47,450 | $11,230 | $36,220 |
| 2016 | $3,320 | $43,390 | $11,230 | $32,160 |
| 2015 | $3,317 | $43,390 | $11,230 | $32,160 |
| 2014 | $3,292 | $43,390 | $11,230 | $32,160 |
| 2013 | $3,140 | $43,390 | $11,230 | $32,160 |
Source: Public Records
Map
Nearby Homes
- 115 Grandin Rd
- 422 Crestview Ave
- 25 Berkshire Ct Unit 3A
- 1568 W Exchange St
- 0 S Hawkins Ave Unit 5162400
- 42 Gloucester Ct Unit 3A
- S/L 39 W Sunset View Dr
- S/L 37 W Sunset View Dr
- S/L 38 W Sunset View Dr
- S/L 40 W Sunset View Dr
- 141 Storer Ave
- 399 Mineola Ave
- 423 S Rose Blvd
- 80 Devon Ln Unit 101A
- 1521 Marlowe Ave
- S/L 2 Sunrise View Dr
- S/L 3 Sunrise View Dr
- S/L 4 Sunrise View Dr
- 598 Mull Ave Unit 9
- 600 Mull Ave Unit 10
Your Personal Tour Guide
Ask me questions while you tour the home.