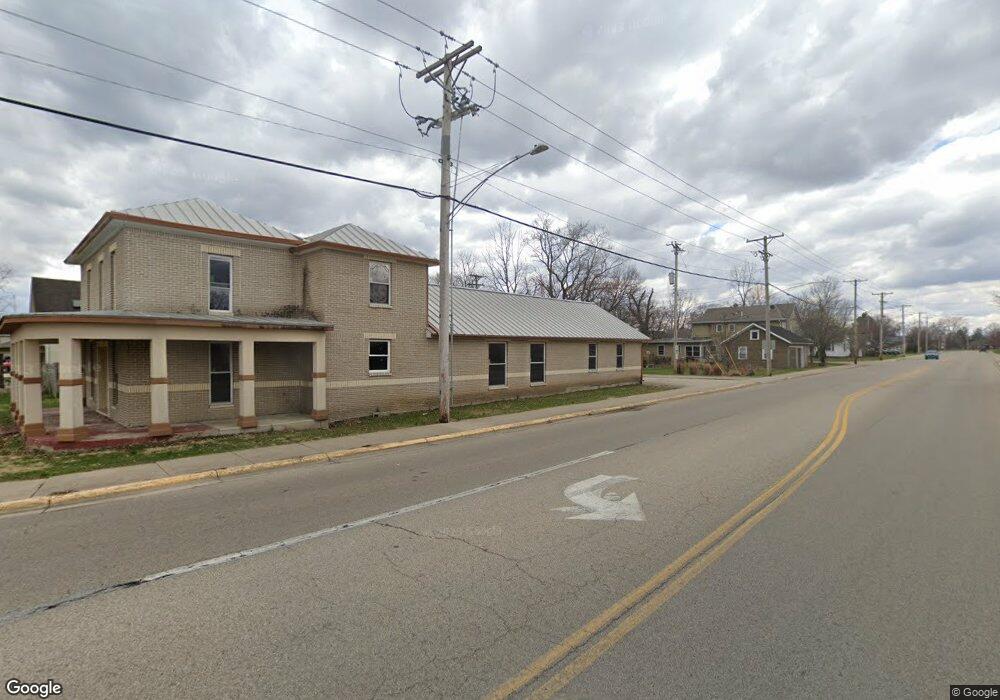
321 N Church St New Carlisle, OH 45344
Estimated Value: $155,000 - $346,000
4
Beds
4
Baths
2,718
Sq Ft
$89/Sq Ft
Est. Value
About This Home
This home is located at 321 N Church St, New Carlisle, OH 45344 and is currently estimated at $241,271, approximately $88 per square foot. 321 N Church St is a home located in Clark County with nearby schools including New Carlisle Elementary School, Park Layne Elementary School, and Donnelsville Elementary School.
Ownership History
Date
Name
Owned For
Owner Type
Purchase Details
Closed on
Jun 8, 2009
Sold by
Fannie Mae
Bought by
Vargas Rocio
Current Estimated Value
Purchase Details
Closed on
Mar 2, 2009
Sold by
Scott Timothy R
Bought by
Federal National Mortgage Association
Purchase Details
Closed on
Sep 25, 2001
Sold by
Scott Tim and Scott Doris
Bought by
Scott Joyce
Purchase Details
Closed on
Apr 15, 1996
Sold by
Krug Properties Co
Bought by
Scott Timothy R and Scott Doris
Home Financials for this Owner
Home Financials are based on the most recent Mortgage that was taken out on this home.
Original Mortgage
$51,300
Interest Rate
7.46%
Mortgage Type
New Conventional
Purchase Details
Closed on
Mar 1, 1985
Create a Home Valuation Report for This Property
The Home Valuation Report is an in-depth analysis detailing your home's value as well as a comparison with similar homes in the area
Home Values in the Area
Average Home Value in this Area
Purchase History
| Date | Buyer | Sale Price | Title Company |
|---|---|---|---|
| Vargas Rocio | $19,000 | Accutitle Agency Inc | |
| Federal National Mortgage Association | $36,000 | None Available | |
| Scott Joyce | -- | -- | |
| Scott Tim | -- | -- | |
| Scott Timothy R | $57,000 | -- | |
| -- | $67,500 | -- |
Source: Public Records
Mortgage History
| Date | Status | Borrower | Loan Amount |
|---|---|---|---|
| Previous Owner | Scott Timothy R | $51,300 |
Source: Public Records
Tax History Compared to Growth
Tax History
| Year | Tax Paid | Tax Assessment Tax Assessment Total Assessment is a certain percentage of the fair market value that is determined by local assessors to be the total taxable value of land and additions on the property. | Land | Improvement |
|---|---|---|---|---|
| 2024 | $8,755 | $74,440 | $9,250 | $65,190 |
| 2023 | $7,131 | $74,440 | $9,250 | $65,190 |
| 2022 | $15,599 | $74,440 | $9,250 | $65,190 |
| 2021 | $3,640 | $63,090 | $7,840 | $55,250 |
| 2020 | $3,649 | $63,090 | $7,840 | $55,250 |
| 2019 | $3,709 | $63,090 | $7,840 | $55,250 |
| 2018 | $1,450 | $22,480 | $10,380 | $12,100 |
| 2017 | $1,353 | $29,173 | $7,406 | $21,767 |
| 2016 | $1,345 | $29,173 | $7,406 | $21,767 |
| 2015 | $2,143 | $30,079 | $7,406 | $22,673 |
| 2014 | $1,370 | $30,079 | $7,406 | $22,673 |
| 2013 | $1,373 | $30,079 | $7,406 | $22,673 |
Source: Public Records
Map
Nearby Homes
- 315 N Main St
- 211 N Clay St
- 202 Fenwick Dr
- 906 N Scott St
- 201 Lightfoot Ct
- 1204 N Scott St
- 216 Lightfoot Ct
- 209 Lightfoot Ct
- 213 Lightfoot Ct
- 315 Fenwick Dr
- 210 Zimmerman St
- 519 Brubaker Dr
- 203 Monroe Way
- 609 Brubaker Dr
- 805 Brookfield Dr
- 703 Brubaker Dr
- 1212 N Scott St
- 1206 N Scott St
- 1205 N Scott St
- 1209 N Scott St
- 319 N Church St
- 316 N Adams St Unit 318
- 201 W Lake Ave
- 203 W Lake Ave
- 314 N Adams St
- 106 W Lake Ave Unit 108
- 316 N Church St
- 310 N Adams St
- 104 W Lake Ave
- 407 N Church St
- 314 N Church St
- 308 N Adams St
- 409 N Church St
- 312 N Church St
- 306 N Adams St
- 317 N Adams St
- 315 N Adams St
- 317 N Main St
- 311 N Adams St
- 306 N Church St