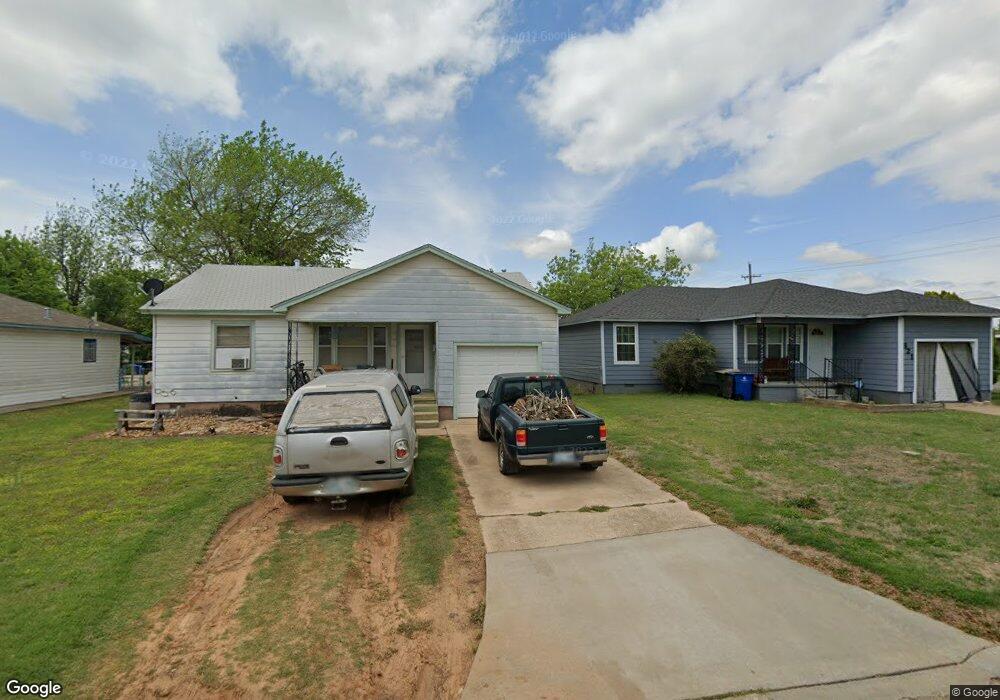
321 N H St Duncan, OK 73533
Estimated Value: $53,000 - $60,000
2
Beds
1
Bath
1,000
Sq Ft
$57/Sq Ft
Est. Value
About This Home
This home is located at 321 N H St, Duncan, OK 73533 and is currently estimated at $57,450, approximately $57 per square foot. 321 N H St is a home located in Stephens County with nearby schools including Woodrow Wilson Elementary School, Duncan Middle School, and Duncan High School.
Ownership History
Date
Name
Owned For
Owner Type
Purchase Details
Closed on
Jun 17, 2025
Sold by
Michel Sherri L and Michel James
Bought by
Garcia Becca and Garcia-Gonzalez Miguel Angel
Current Estimated Value
Purchase Details
Closed on
Jan 22, 2021
Sold by
Diaz Ramirez Martin A and Diaz Maria
Bought by
Michel Sherri L
Home Financials for this Owner
Home Financials are based on the most recent Mortgage that was taken out on this home.
Original Mortgage
$41,520
Interest Rate
2.71%
Mortgage Type
Commercial
Purchase Details
Closed on
Apr 26, 2011
Sold by
Secerateryof Hud
Bought by
Diaz Martin A
Home Financials for this Owner
Home Financials are based on the most recent Mortgage that was taken out on this home.
Original Mortgage
$14,709
Interest Rate
4.87%
Mortgage Type
Purchase Money Mortgage
Purchase Details
Closed on
Oct 20, 2010
Sold by
Meadows Kathy E
Bought by
Secretary Of Hud
Purchase Details
Closed on
Mar 14, 2003
Sold by
London Esther
Purchase Details
Closed on
Mar 16, 1998
Sold by
Godbey John W
Create a Home Valuation Report for This Property
The Home Valuation Report is an in-depth analysis detailing your home's value as well as a comparison with similar homes in the area
Home Values in the Area
Average Home Value in this Area
Purchase History
| Date | Buyer | Sale Price | Title Company |
|---|---|---|---|
| Garcia Becca | $57,000 | Old Republic Title | |
| Garcia Becca | $57,000 | Old Republic Title | |
| Michel Sherri L | $46,000 | Stephens County Abstract Co | |
| Diaz Martin A | -- | None Available | |
| Secretary Of Hud | $26,667 | None Available | |
| -- | $29,000 | -- | |
| -- | $25,000 | -- |
Source: Public Records
Mortgage History
| Date | Status | Borrower | Loan Amount |
|---|---|---|---|
| Previous Owner | Michel Sherri L | $41,520 | |
| Previous Owner | Diaz Martin A | $14,709 |
Source: Public Records
Tax History Compared to Growth
Tax History
| Year | Tax Paid | Tax Assessment Tax Assessment Total Assessment is a certain percentage of the fair market value that is determined by local assessors to be the total taxable value of land and additions on the property. | Land | Improvement |
|---|---|---|---|---|
| 2025 | $469 | $5,561 | $379 | $5,182 |
| 2024 | $451 | $5,297 | $379 | $4,918 |
| 2023 | $451 | $5,045 | $379 | $4,666 |
| 2022 | $433 | $5,096 | $379 | $4,717 |
| 2021 | $195 | $3,298 | $379 | $2,919 |
| 2020 | $182 | $3,109 | $379 | $2,730 |
| 2019 | $175 | $3,018 | $379 | $2,639 |
| 2018 | $172 | $2,930 | $379 | $2,551 |
| 2017 | $174 | $3,030 | $379 | $2,651 |
| 2016 | $278 | $4,268 | $348 | $3,920 |
| 2015 | $363 | $4,144 | $339 | $3,805 |
| 2014 | $363 | $4,023 | $330 | $3,693 |
Source: Public Records
Map
Nearby Homes