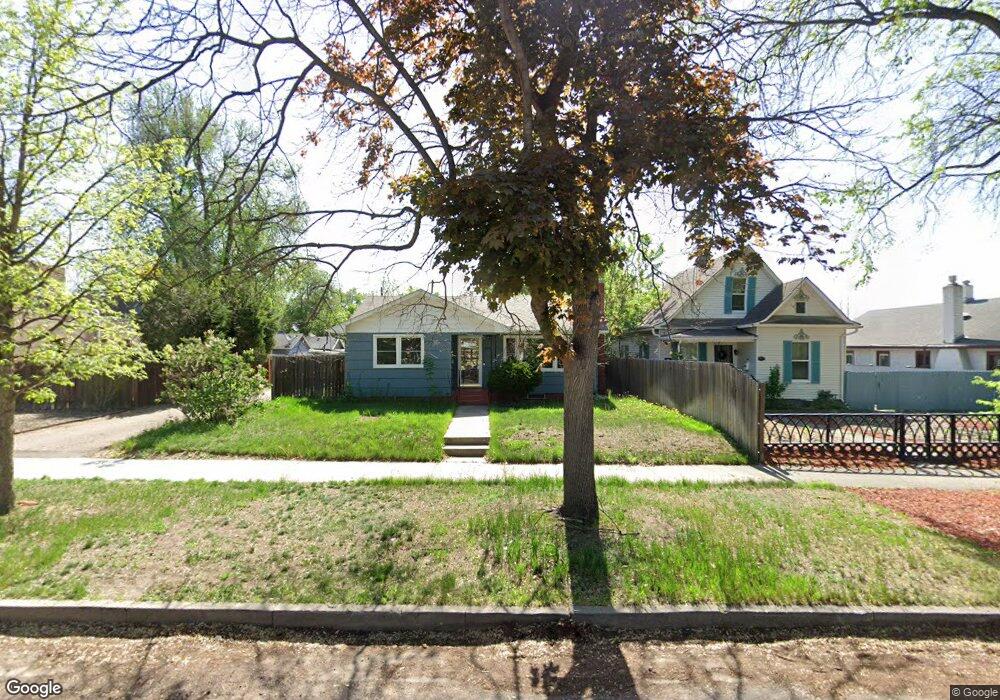
321 N Sheridan Ave Colorado Springs, CO 80909
Middle Shooks Run NeighborhoodEstimated Value: $523,737 - $648,000
4
Beds
3
Baths
1,506
Sq Ft
$387/Sq Ft
Est. Value
About This Home
This home is located at 321 N Sheridan Ave, Colorado Springs, CO 80909 and is currently estimated at $583,184, approximately $387 per square foot. 321 N Sheridan Ave is a home located in El Paso County with nearby schools including Columbia Elementary School, North Middle School, and William J. Palmer High School.
Ownership History
Date
Name
Owned For
Owner Type
Purchase Details
Closed on
Apr 13, 2018
Sold by
Stepp Nancy T and Stepp Steven P
Bought by
Lee David W and Lee Deborah A
Current Estimated Value
Home Financials for this Owner
Home Financials are based on the most recent Mortgage that was taken out on this home.
Original Mortgage
$299,250
Outstanding Balance
$257,290
Interest Rate
4.43%
Mortgage Type
New Conventional
Estimated Equity
$325,894
Purchase Details
Closed on
Nov 19, 2003
Sold by
Stepp Nancy T
Bought by
Stepp Nancy T and Stepp Steven P
Home Financials for this Owner
Home Financials are based on the most recent Mortgage that was taken out on this home.
Original Mortgage
$172,000
Interest Rate
6.06%
Mortgage Type
Unknown
Purchase Details
Closed on
Feb 18, 1994
Sold by
Wathen Joan E and Harns Joan E
Bought by
Harns Joseph H and Harns Naomi D
Purchase Details
Closed on
Feb 7, 1994
Sold by
Harns Naomi D and Zeller Linda S
Bought by
Harns Joseph H and Harns Naomi D
Create a Home Valuation Report for This Property
The Home Valuation Report is an in-depth analysis detailing your home's value as well as a comparison with similar homes in the area
Home Values in the Area
Average Home Value in this Area
Purchase History
| Date | Buyer | Sale Price | Title Company |
|---|---|---|---|
| Lee David W | $399,000 | Legacy Title Group | |
| Stepp Nancy T | -- | -- | |
| Stepp Nancy T | $215,000 | Land Title | |
| Harns Joseph H | -- | -- | |
| Harns Joseph H | -- | -- |
Source: Public Records
Mortgage History
| Date | Status | Borrower | Loan Amount |
|---|---|---|---|
| Open | Lee David W | $299,250 | |
| Previous Owner | Stepp Nancy T | $172,000 | |
| Closed | Stepp Nancy T | $43,000 |
Source: Public Records
Tax History Compared to Growth
Tax History
| Year | Tax Paid | Tax Assessment Tax Assessment Total Assessment is a certain percentage of the fair market value that is determined by local assessors to be the total taxable value of land and additions on the property. | Land | Improvement |
|---|---|---|---|---|
| 2025 | $2,217 | $47,170 | -- | -- |
| 2024 | $2,095 | $44,370 | $4,930 | $39,440 |
| 2022 | $1,866 | $33,350 | $4,570 | $28,780 |
| 2021 | $2,025 | $34,310 | $4,700 | $29,610 |
| 2020 | $1,917 | $28,240 | $3,620 | $24,620 |
| 2019 | $1,720 | $25,480 | $3,620 | $21,860 |
| 2018 | $1,318 | $17,960 | $2,970 | $14,990 |
| 2017 | $1,248 | $17,960 | $2,970 | $14,990 |
| 2016 | $969 | $16,710 | $2,740 | $13,970 |
| 2015 | -- | $16,710 | $2,740 | $13,970 |
Source: Public Records
Map
Nearby Homes
- 1302 E Platte Ave
- 1220 E Platte Ave
- 1326 E Platte Ave
- 208 N Foote Ave
- 1220 E Bijou St
- 230 N Hancock Ave
- 228 N Hancock Ave
- 237 N Cedar St
- 424 N Cedar St
- 107 N Logan Ave
- 411 Custer Ave
- 225 Custer Ave
- 223 Custer Ave
- 106 Farragut Ave
- 208 Custer Ave
- 1418 E Pikes Peak Ave
- 908 E High St
- 628 N Sheridan Ave
- 632 N Foote Ave
- 31 N Meade Ave
- 317 N Sheridan Ave
- 327 N Sheridan Ave
- 1309 E Boulder St
- 313 N Sheridan Ave
- 1311 E Boulder St
- 331 N Sheridan Ave
- 1315 E Boulder St
- 322 N Foote Ave
- 1319 E Boulder St
- 318 N Foote Ave
- 1310 E Platte Ave
- 1306 E Platte Ave
- 1314 E Platte Ave
- 312 N Foote Ave
- 1227 E Boulder St
- 1318 E Platte Ave
- 326 N Foote Ave
- 322 N Sheridan Ave
- 1223 E Boulder St
- 318 N Sheridan Ave