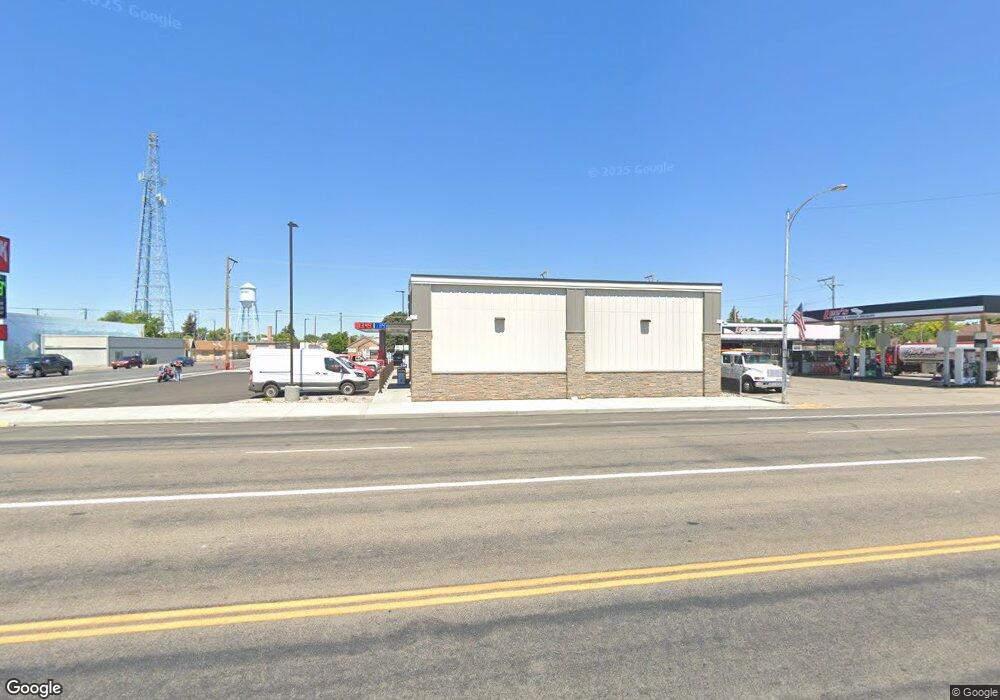
321 NW Main St Blackfoot, ID 83221
Estimated Value: $1,334,598
--
Bed
3
Baths
18,028
Sq Ft
$74/Sq Ft
Est. Value
About This Home
This home is located at 321 NW Main St, Blackfoot, ID 83221 and is currently estimated at $1,334,598, approximately $74 per square foot. 321 NW Main St is a home located in Bingham County with nearby schools including Ridge Crest Elementary School, Blackfoot High School, and Blackfoot Charter Community Learning Center.
Ownership History
Date
Name
Owned For
Owner Type
Purchase Details
Closed on
Sep 29, 2023
Sold by
Davila Raymundo
Bought by
Maverik Inc
Current Estimated Value
Purchase Details
Closed on
Feb 1, 2010
Sold by
A J Investments Inc
Bought by
Davila Raymundo
Home Financials for this Owner
Home Financials are based on the most recent Mortgage that was taken out on this home.
Original Mortgage
$107,500
Interest Rate
4.91%
Mortgage Type
Commercial
Create a Home Valuation Report for This Property
The Home Valuation Report is an in-depth analysis detailing your home's value as well as a comparison with similar homes in the area
Home Values in the Area
Average Home Value in this Area
Purchase History
| Date | Buyer | Sale Price | Title Company |
|---|---|---|---|
| Maverik Inc | -- | First American Title | |
| Davila Raymundo | -- | -- |
Source: Public Records
Mortgage History
| Date | Status | Borrower | Loan Amount |
|---|---|---|---|
| Previous Owner | Davila Raymundo | $107,500 |
Source: Public Records
Tax History Compared to Growth
Tax History
| Year | Tax Paid | Tax Assessment Tax Assessment Total Assessment is a certain percentage of the fair market value that is determined by local assessors to be the total taxable value of land and additions on the property. | Land | Improvement |
|---|---|---|---|---|
| 2025 | $225 | $1,741,850 | $93,750 | $1,648,100 |
| 2024 | $225 | $18,750 | $18,750 | $0 |
| 2023 | $3,228 | $261,550 | $18,750 | $242,800 |
| 2022 | $3,732 | $261,550 | $18,750 | $242,800 |
| 2021 | $5,716 | $261,550 | $18,750 | $242,800 |
| 2020 | $5,086 | $235,890 | $0 | $0 |
| 2019 | $5,427 | $235,890 | $0 | $0 |
| 2018 | $5,740 | $235,890 | $18,000 | $217,890 |
| 2017 | $5,414 | $235,890 | $18,000 | $217,890 |
| 2016 | $5,320 | $235,890 | $0 | $0 |
| 2015 | $4,405 | $198,380 | $0 | $0 |
| 2014 | $4,157 | $198,380 | $18,000 | $180,380 |
Source: Public Records
Map
Nearby Homes
- TBD E 335 N
- 462 NE Main St
- 521 N Shilling Ave
- 365 N University Ave
- 19 N Shilling Ave
- 9 N Shilling Ave
- 183 N Oak St
- 700 N Shilling Ave
- 380 W Judicial St
- 314 E Bridge St
- 216 Jefferson St
- 15 Louella St
- 915 Lilac St
- 21 Louella St
- 260 Gifford St
- 89 W Center St
- 789 W Sexton St
- 362 Sonny St
- 329 S Birch St
- 861 W Sexton St
- 300 N Broadway St
- 372 N Broadway St
- 56 W Francis St
- 60 W Francis St
- 211 W N Unit 740
- 390 N Broadway St
- 298 N Broadway St
- 556 N Broadway St
- TBD W 400 N
- 255 NW Main St
- 63 W Francis St
- 260 N Broadway St
- 311 N Broadway St Unit 311 B
- 311 N Broadway St
- 311 N Broadway St
- 359 N Broadway St
- 310 NW Main St
- 391 N Broadway St
- 137 W Alice St
- 465 NW Main St