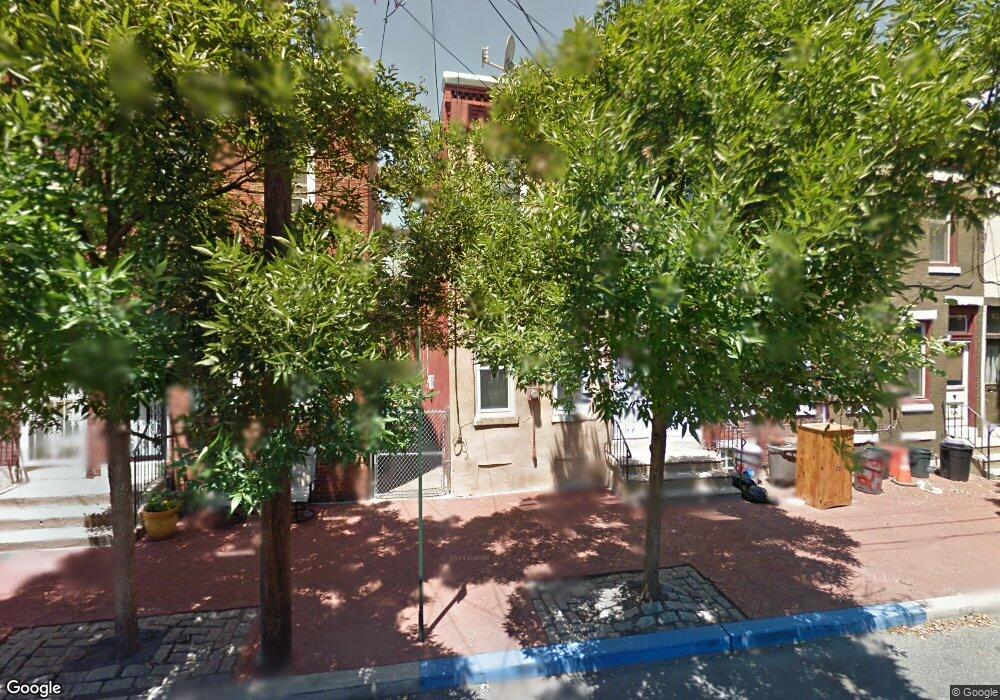
321 Point St Camden, NJ 08102
Cooper Grant NeighborhoodEstimated Value: $164,090 - $324,000
Studio
--
Bath
1,456
Sq Ft
$167/Sq Ft
Est. Value
About This Home
This home is located at 321 Point St, Camden, NJ 08102 and is currently estimated at $243,523, approximately $167 per square foot. 321 Point St is a home located in Camden County with nearby schools including Eastside High School, Leap Academy University Charter School, and Hope Community Charter School.
Ownership History
Date
Name
Owned For
Owner Type
Purchase Details
Closed on
Jul 27, 2007
Sold by
Rodriguez Nereida and Rodriguez Sandra
Bought by
Rodriguez Nerieda and Ithier Maribel
Current Estimated Value
Home Financials for this Owner
Home Financials are based on the most recent Mortgage that was taken out on this home.
Original Mortgage
$121,600
Outstanding Balance
$77,227
Interest Rate
6.72%
Mortgage Type
New Conventional
Estimated Equity
$166,296
Purchase Details
Closed on
Jun 5, 2007
Sold by
Rodriguez Monserrate and Rodriguez Maribel
Bought by
Rodiguez Nerieda and Rodriguez Sandra
Home Financials for this Owner
Home Financials are based on the most recent Mortgage that was taken out on this home.
Original Mortgage
$121,600
Outstanding Balance
$77,227
Interest Rate
6.72%
Mortgage Type
New Conventional
Estimated Equity
$166,296
Create a Home Valuation Report for This Property
The Home Valuation Report is an in-depth analysis detailing your home's value as well as a comparison with similar homes in the area
Home Values in the Area
Average Home Value in this Area
Purchase History
| Date | Buyer | Sale Price | Title Company |
|---|---|---|---|
| Rodriguez Nerieda | -- | -- | |
| Rodiguez Nerieda | -- | -- | |
| Rodriguez Nereida | -- | -- |
Source: Public Records
Mortgage History
| Date | Status | Borrower | Loan Amount |
|---|---|---|---|
| Open | Rodriguez Nerieda | $121,600 |
Source: Public Records
Tax History
| Year | Tax Paid | Tax Assessment Tax Assessment Total Assessment is a certain percentage of the fair market value that is determined by local assessors to be the total taxable value of land and additions on the property. | Land | Improvement |
|---|---|---|---|---|
| 2025 | $2,884 | $81,400 | $28,600 | $52,800 |
| 2024 | $2,788 | $81,400 | $28,600 | $52,800 |
| 2023 | $2,788 | $81,400 | $28,600 | $52,800 |
| 2022 | $2,736 | $81,400 | $28,600 | $52,800 |
| 2021 | $2,726 | $81,400 | $28,600 | $52,800 |
| 2020 | $2,589 | $81,400 | $28,600 | $52,800 |
| 2019 | $2,479 | $81,400 | $28,600 | $52,800 |
| 2018 | $2,466 | $81,400 | $28,600 | $52,800 |
| 2017 | $2,405 | $81,400 | $28,600 | $52,800 |
| 2016 | $2,329 | $81,400 | $28,600 | $52,800 |
| 2015 | $2,242 | $81,400 | $28,600 | $52,800 |
| 2014 | $2,188 | $81,400 | $28,600 | $52,800 |
Source: Public Records
Map
Nearby Homes
- 117 Linden St
- 526 Cooper St
- 910 Point St
- 912 Point St
- 914 Point St
- 426 State St
- 107 N 6th St
- 906 N 4th St
- 707 N 6th St
- 934 N 4th St
- 832 N 6th St
- 639 State St
- 722 Cedar St
- 627 York St
- 321 Washington St
- 7 N Christopher Columbus Blvd Unit 130
- 3 N Columbus Blvd Unit PL202
- 826 State St
- 507 S 4th St
- 3 N Columbus Blvd Unit TD405
Your Personal Tour Guide
Ask me questions while you tour the home.