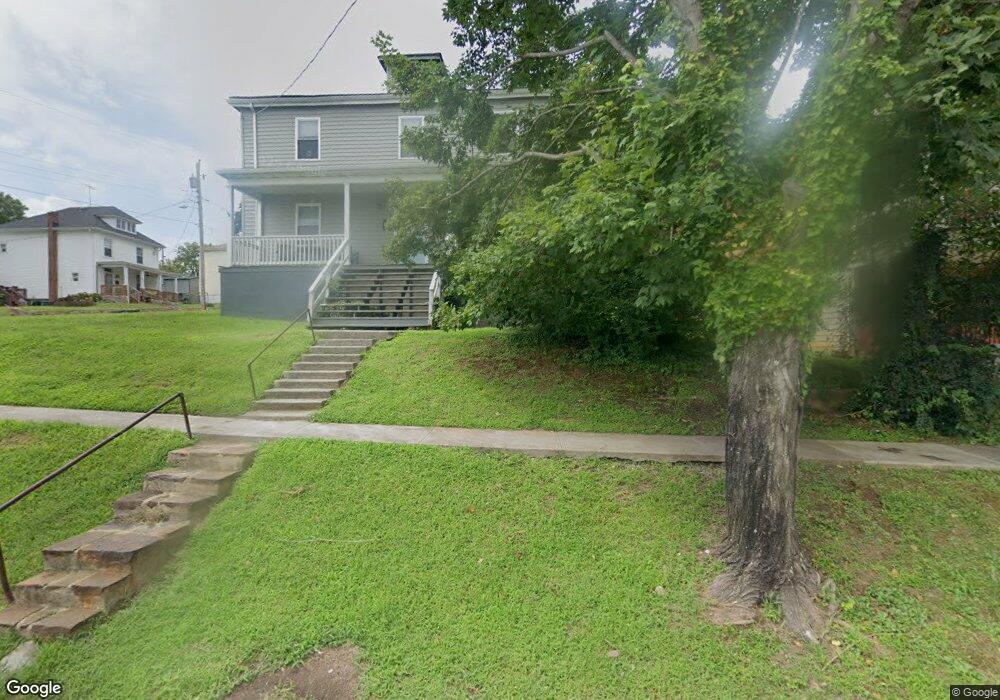
321 Polk St Lynchburg, VA 24504
Tinbridge Hill NeighborhoodEstimated Value: $182,000 - $213,000
2
Beds
2
Baths
1,100
Sq Ft
$178/Sq Ft
Est. Value
About This Home
This home is located at 321 Polk St, Lynchburg, VA 24504 and is currently estimated at $196,333, approximately $178 per square foot. 321 Polk St is a home located in Lynchburg City with nearby schools including Bedford Hills Elementary School, Linkhorne Middle School, and E.C. Glass High School.
Ownership History
Date
Name
Owned For
Owner Type
Purchase Details
Closed on
Jan 21, 2019
Sold by
Davenport Nina S
Bought by
Covenant Holdings Llc
Current Estimated Value
Purchase Details
Closed on
Feb 20, 2018
Sold by
Horner Benjamin and Horner Wendy
Bought by
Davenport Nina S
Purchase Details
Closed on
Mar 8, 2007
Sold by
Villarreal Annette K
Bought by
Villarreal Paul T and Villarreal Annette K
Create a Home Valuation Report for This Property
The Home Valuation Report is an in-depth analysis detailing your home's value as well as a comparison with similar homes in the area
Home Values in the Area
Average Home Value in this Area
Purchase History
| Date | Buyer | Sale Price | Title Company |
|---|---|---|---|
| Covenant Holdings Llc | -- | None Available | |
| Davenport Nina S | $15,000 | Absolute Title & Settlement | |
| Villarreal Paul T | -- | None Available |
Source: Public Records
Tax History Compared to Growth
Tax History
| Year | Tax Paid | Tax Assessment Tax Assessment Total Assessment is a certain percentage of the fair market value that is determined by local assessors to be the total taxable value of land and additions on the property. | Land | Improvement |
|---|---|---|---|---|
| 2025 | $1,651 | $196,600 | $18,000 | $178,600 |
| 2024 | $1,410 | $158,400 | $14,400 | $144,000 |
| 2023 | $156 | $158,400 | $14,400 | $144,000 |
| 2022 | $163 | $139,100 | $12,000 | $127,100 |
| 2021 | $1,544 | $139,100 | $12,000 | $127,100 |
| 2020 | $151 | $136,900 | $8,400 | $128,500 |
| 2019 | $151 | $136,900 | $8,400 | $128,500 |
| 2018 | $124 | $11,200 | $6,000 | $5,200 |
| 2017 | $124 | $11,200 | $6,000 | $5,200 |
| 2016 | $124 | $11,200 | $6,000 | $5,200 |
| 2015 | $124 | $11,200 | $2,000 | $9,200 |
| 2014 | $62 | $37,500 | $2,000 | $35,500 |
Source: Public Records
Map
Nearby Homes