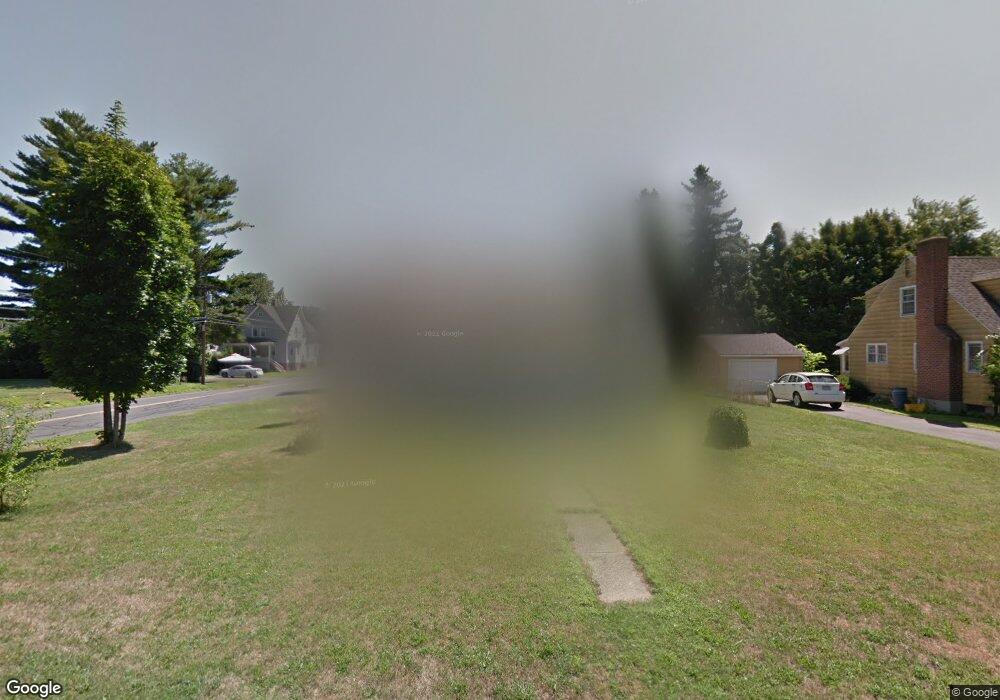
321 Roxbury Rd New Britain, CT 06053
Estimated Value: $296,188 - $312,000
3
Beds
2
Baths
1,498
Sq Ft
$202/Sq Ft
Est. Value
About This Home
This home is located at 321 Roxbury Rd, New Britain, CT 06053 and is currently estimated at $302,047, approximately $201 per square foot. 321 Roxbury Rd is a home located in Hartford County with nearby schools including Holmes School, Pulaski Middle School, and St. Francis of Assisi Middle School.
Ownership History
Date
Name
Owned For
Owner Type
Purchase Details
Closed on
Jan 9, 2025
Sold by
Cruickshank David
Bought by
Dac T T and Dac Cruickshank
Current Estimated Value
Purchase Details
Closed on
Nov 1, 1991
Sold by
Labella John C
Bought by
Carey Lynn A
Home Financials for this Owner
Home Financials are based on the most recent Mortgage that was taken out on this home.
Original Mortgage
$85,000
Interest Rate
8.9%
Mortgage Type
Purchase Money Mortgage
Create a Home Valuation Report for This Property
The Home Valuation Report is an in-depth analysis detailing your home's value as well as a comparison with similar homes in the area
Home Values in the Area
Average Home Value in this Area
Purchase History
| Date | Buyer | Sale Price | Title Company |
|---|---|---|---|
| Dac T T | -- | None Available | |
| Dac T T | -- | None Available | |
| Carey Lynn A | $95,000 | -- |
Source: Public Records
Mortgage History
| Date | Status | Borrower | Loan Amount |
|---|---|---|---|
| Previous Owner | Carey Lynn A | $157,102 | |
| Previous Owner | Carey Lynn A | $85,000 |
Source: Public Records
Tax History
| Year | Tax Paid | Tax Assessment Tax Assessment Total Assessment is a certain percentage of the fair market value that is determined by local assessors to be the total taxable value of land and additions on the property. | Land | Improvement |
|---|---|---|---|---|
| 2025 | $5,425 | $138,460 | $53,970 | $84,490 |
| 2024 | $5,482 | $138,460 | $53,970 | $84,490 |
| 2023 | $5,300 | $138,460 | $53,970 | $84,490 |
| 2022 | $4,782 | $96,600 | $24,850 | $71,750 |
| 2021 | $4,782 | $96,600 | $24,850 | $71,750 |
| 2020 | $4,878 | $96,600 | $24,850 | $71,750 |
| 2019 | $4,878 | $96,600 | $24,850 | $71,750 |
| 2018 | $4,878 | $96,600 | $24,850 | $71,750 |
| 2017 | $4,518 | $89,460 | $22,610 | $66,850 |
| 2016 | $4,518 | $89,460 | $22,610 | $66,850 |
| 2015 | $4,384 | $89,460 | $22,610 | $66,850 |
| 2014 | $4,384 | $89,460 | $22,610 | $66,850 |
Source: Public Records
Map
Nearby Homes
- 497 Commonwealth Ave
- 1634 Stanley St
- 26 Magnolia St
- 72 Hillcrest Ave
- 154 Allen St
- 170 Wilcox St
- 255 Lasalle St
- 474 Eddy Glover Blvd
- 45 Atlantic St Unit C
- 432 Mcclintock St
- 142 Lasalle St
- 57 Foxon Place
- 50 Long St Unit 5
- 55 Allen St
- 89 Hazelmere Rd
- 227 Amherst St
- 144 West St
- 33 Recano Rd
- 50 Curtin Ave
- 27 Janet Dr