Estimated Value: $128,778 - $143,000
2
Beds
1
Bath
768
Sq Ft
$176/Sq Ft
Est. Value
About This Home
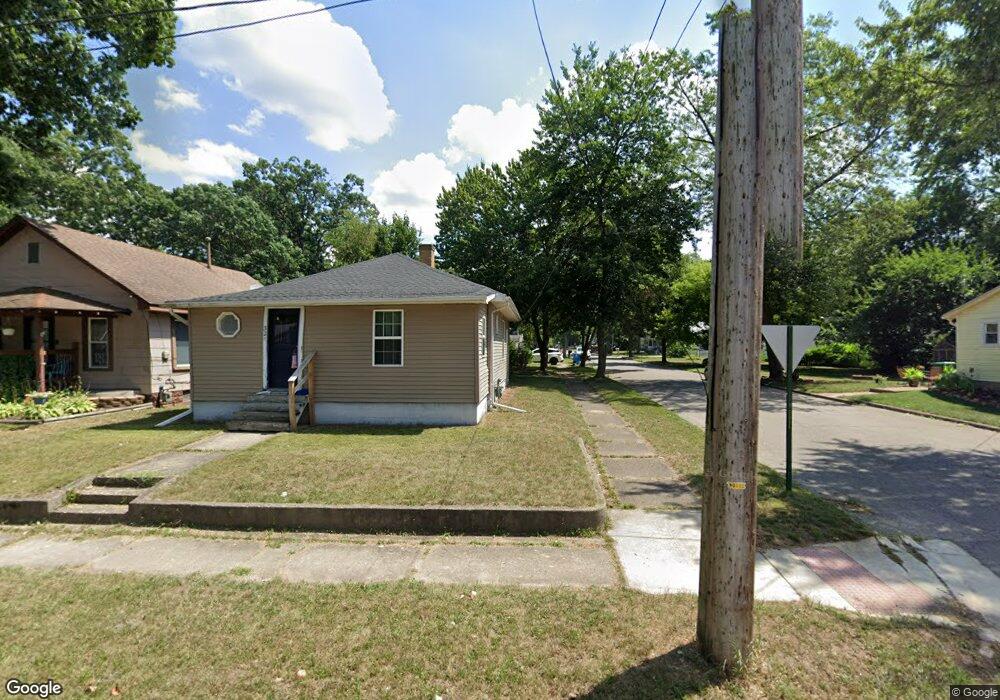
This home is located at 321 S 15th St, Niles, MI 49120 and is currently estimated at $135,445, approximately $176 per square foot. 321 S 15th St is a home located in Berrien County with nearby schools including James Ellis School, Howard-Ellis Elementary School, and Oak Manor Sixth Grade Center.
Ownership History
Date
Name
Owned For
Owner Type
Purchase Details
Closed on
Mar 8, 2023
Sold by
Hammond Gregory Mark
Bought by
Johns William and Johns Kelsey
Current Estimated Value
Purchase Details
Closed on
Jan 29, 2018
Sold by
Marhman Rachelle Nicole and Marhman Gregory Mark
Bought by
Hammond Mark and Hammond Rahcelle Nicole
Purchase Details
Closed on
Sep 15, 2017
Sold by
Hammond Gregory M
Bought by
Tibbs Kodee
Home Financials for this Owner
Home Financials are based on the most recent Mortgage that was taken out on this home.
Original Mortgage
$63,000
Interest Rate
3.93%
Mortgage Type
Seller Take Back
Purchase Details
Closed on
Dec 19, 2007
Sold by
The Estate Of Bessie Anton
Bought by
Hammond Gregory M and Marshman Rachelle N
Home Financials for this Owner
Home Financials are based on the most recent Mortgage that was taken out on this home.
Original Mortgage
$59,392
Interest Rate
6.31%
Mortgage Type
VA
Purchase Details
Closed on
Apr 19, 1999
Purchase Details
Closed on
Apr 1, 1976
Create a Home Valuation Report for This Property
The Home Valuation Report is an in-depth analysis detailing your home's value as well as a comparison with similar homes in the area
Home Values in the Area
Average Home Value in this Area
Purchase History
| Date | Buyer | Sale Price | Title Company |
|---|---|---|---|
| Johns William | $58,500 | Chicago Title | |
| Hammond Gregory M | -- | Chicago Title | |
| Hammond Mark | -- | None Available | |
| Tibbs Kodee | $65,000 | None Available | |
| Hammond Gregory M | $58,000 | Metropolitan Title Company | |
| -- | $100 | -- | |
| -- | $12,000 | -- |
Source: Public Records
Mortgage History
| Date | Status | Borrower | Loan Amount |
|---|---|---|---|
| Previous Owner | Tibbs Kodee | $63,000 | |
| Previous Owner | Hammond Gregory M | $59,392 |
Source: Public Records
Tax History
| Year | Tax Paid | Tax Assessment Tax Assessment Total Assessment is a certain percentage of the fair market value that is determined by local assessors to be the total taxable value of land and additions on the property. | Land | Improvement |
|---|---|---|---|---|
| 2025 | $3,075 | $59,500 | $0 | $0 |
| 2024 | $1,641 | $55,100 | $0 | $0 |
| 2023 | $864 | $47,900 | $0 | $0 |
| 2022 | $823 | $44,600 | $0 | $0 |
| 2021 | $1,014 | $41,600 | $2,500 | $39,100 |
| 2020 | $1,003 | $32,700 | $0 | $0 |
| 2019 | $20 | $36,800 | $6,800 | $30,000 |
| 2018 | $1,474 | $36,800 | $0 | $0 |
| 2017 | $1,458 | $33,600 | $0 | $0 |
| 2016 | $1,434 | $28,500 | $0 | $0 |
| 2015 | $1,362 | $25,700 | $0 | $0 |
| 2014 | $889 | $25,500 | $0 | $0 |
Source: Public Records
Map
Nearby Homes
- 324 S 15th St
- 1638 Superior St
- 1648 Oak St
- 1451 Cedar St
- 0 S 15th St
- V/L S 15th St
- 1408 Silverbrook Ave
- 1008 Oak St
- 920 Cherry St
- 17 S 10th St
- 1314 Ferry St
- 2112 Kathryn Dr
- V/L Kathryn St Unit Tract 3
- 2451 Spansail Dr
- 319 S 5th St
- 718 Regent St
- 400 Carefree Ct
- 622 N 13th St
- 0 Kathryn St Unit Tract 1
- 1316 Eagle St
Your Personal Tour Guide
Ask me questions while you tour the home.