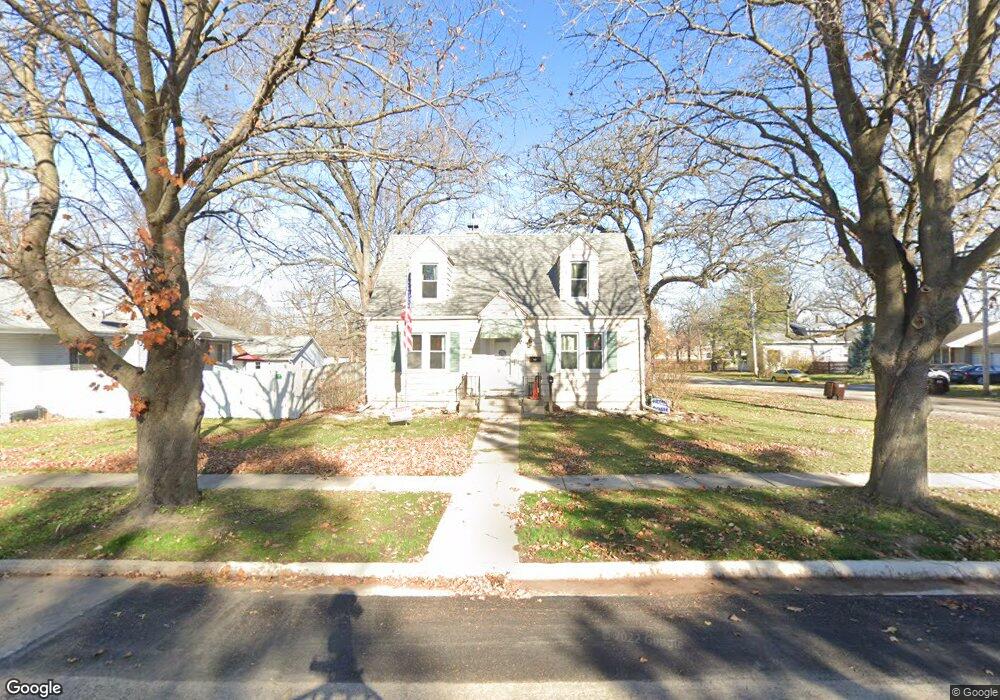
321 S 2nd St Rochelle, IL 61068
Estimated Value: $147,899 - $183,000
4
Beds
1
Bath
1,600
Sq Ft
$101/Sq Ft
Est. Value
About This Home
This home is located at 321 S 2nd St, Rochelle, IL 61068 and is currently estimated at $160,975, approximately $100 per square foot. 321 S 2nd St is a home located in Ogle County with nearby schools including Rochelle Township High School and St. Paul Lutheran School.
Ownership History
Date
Name
Owned For
Owner Type
Purchase Details
Closed on
Mar 19, 2008
Sold by
Phillips Gary L and Phillips Rachelle N
Bought by
Phillips Gary L
Current Estimated Value
Home Financials for this Owner
Home Financials are based on the most recent Mortgage that was taken out on this home.
Original Mortgage
$127,991
Outstanding Balance
$79,586
Interest Rate
5.79%
Mortgage Type
FHA
Estimated Equity
$81,389
Purchase Details
Closed on
Dec 20, 2006
Sold by
Hall Michael E
Bought by
Phillips Gary L and Phillips Rachelle N
Home Financials for this Owner
Home Financials are based on the most recent Mortgage that was taken out on this home.
Original Mortgage
$130,000
Interest Rate
6.36%
Mortgage Type
New Conventional
Create a Home Valuation Report for This Property
The Home Valuation Report is an in-depth analysis detailing your home's value as well as a comparison with similar homes in the area
Home Values in the Area
Average Home Value in this Area
Purchase History
| Date | Buyer | Sale Price | Title Company |
|---|---|---|---|
| Phillips Gary L | -- | None Available | |
| Phillips Gary L | $128,000 | None Available |
Source: Public Records
Mortgage History
| Date | Status | Borrower | Loan Amount |
|---|---|---|---|
| Open | Phillips Gary L | $127,991 | |
| Previous Owner | Phillips Gary L | $130,000 |
Source: Public Records
Tax History Compared to Growth
Tax History
| Year | Tax Paid | Tax Assessment Tax Assessment Total Assessment is a certain percentage of the fair market value that is determined by local assessors to be the total taxable value of land and additions on the property. | Land | Improvement |
|---|---|---|---|---|
| 2024 | $2,902 | $38,810 | $6,494 | $32,316 |
| 2023 | $2,680 | $36,322 | $6,078 | $30,244 |
| 2022 | $2,661 | $34,563 | $5,784 | $28,779 |
| 2021 | $2,486 | $31,929 | $5,343 | $26,586 |
| 2020 | $2,364 | $30,409 | $5,089 | $25,320 |
| 2019 | $2,311 | $29,886 | $5,001 | $24,885 |
| 2018 | $2,243 | $29,300 | $4,903 | $24,397 |
| 2017 | $2,212 | $29,300 | $4,903 | $24,397 |
| 2016 | $2,179 | $28,497 | $4,769 | $23,728 |
| 2015 | $2,108 | $28,020 | $4,689 | $23,331 |
| 2014 | $2,211 | $28,020 | $4,689 | $23,331 |
| 2013 | $2,336 | $29,375 | $4,916 | $24,459 |
Source: Public Records
Map
Nearby Homes