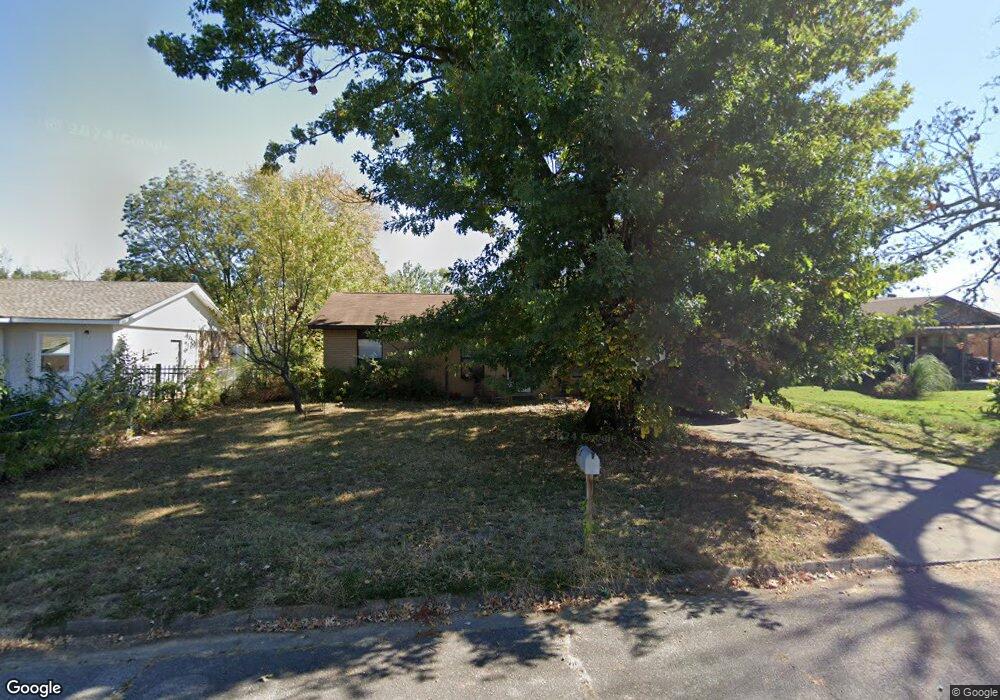
321 S 41st St van Buren, AR 72956
Estimated Value: $88,000 - $142,000
--
Bed
2
Baths
1,174
Sq Ft
$103/Sq Ft
Est. Value
About This Home
This home is located at 321 S 41st St, van Buren, AR 72956 and is currently estimated at $120,873, approximately $102 per square foot. 321 S 41st St is a home located in Crawford County with nearby schools including James R. Tate Elementary School, Butterfield Trail Middle School, and Van Buren High School.
Ownership History
Date
Name
Owned For
Owner Type
Purchase Details
Closed on
Oct 27, 2017
Sold by
Wells Fargo Bank Na
Bought by
Port City Properties Llc
Current Estimated Value
Purchase Details
Closed on
Jan 4, 2002
Bought by
Hoffman Conrad
Purchase Details
Closed on
Jul 27, 2001
Bought by
Williams-Leader
Purchase Details
Closed on
Sep 2, 1999
Bought by
Almonds-Williams
Purchase Details
Closed on
Apr 5, 1999
Bought by
Walls-Almond
Purchase Details
Closed on
Feb 27, 1998
Bought by
Isaacs-Walts
Create a Home Valuation Report for This Property
The Home Valuation Report is an in-depth analysis detailing your home's value as well as a comparison with similar homes in the area
Home Values in the Area
Average Home Value in this Area
Purchase History
| Date | Buyer | Sale Price | Title Company |
|---|---|---|---|
| Port City Properties Llc | $33,500 | Guaranty Abstract & Title Co | |
| Hoffman Conrad | $42,000 | -- | |
| Williams-Leader | $56,000 | -- | |
| Almonds-Williams | $51,000 | -- | |
| Walls-Almond | $34,000 | -- | |
| Isaacs-Walts | -- | -- |
Source: Public Records
Tax History Compared to Growth
Tax History
| Year | Tax Paid | Tax Assessment Tax Assessment Total Assessment is a certain percentage of the fair market value that is determined by local assessors to be the total taxable value of land and additions on the property. | Land | Improvement |
|---|---|---|---|---|
| 2025 | $817 | $20,000 | $3,000 | $17,000 |
| 2024 | $754 | $20,000 | $3,000 | $17,000 |
| 2023 | $691 | $20,000 | $3,000 | $17,000 |
| 2022 | $628 | $12,106 | $2,000 | $10,106 |
| 2021 | $628 | $12,106 | $2,000 | $10,106 |
| 2020 | $628 | $12,106 | $2,000 | $10,106 |
| 2019 | $628 | $12,106 | $2,000 | $10,106 |
| 2018 | $628 | $12,106 | $2,000 | $10,106 |
| 2017 | $40 | $14,370 | $2,000 | $12,370 |
| 2016 | $396 | $14,370 | $2,000 | $12,370 |
| 2015 | $353 | $14,370 | $2,000 | $12,370 |
| 2014 | $353 | $14,370 | $2,000 | $12,370 |
Source: Public Records
Map
Nearby Homes