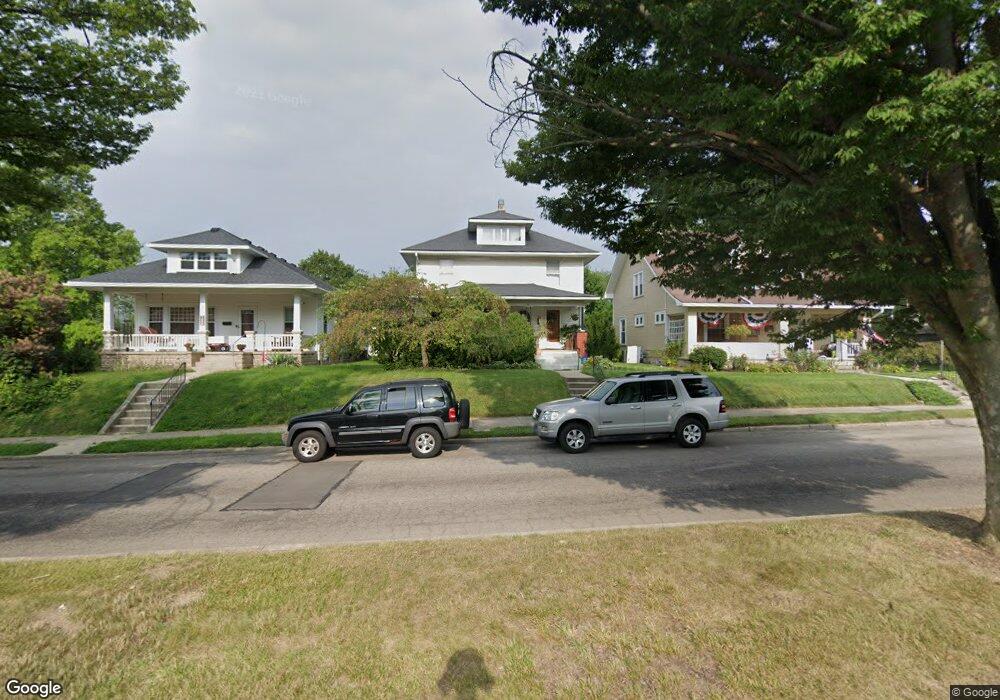
321 S Arlington Ave Springfield, OH 45505
Estimated Value: $109,000 - $171,000
3
Beds
1
Bath
1,374
Sq Ft
$101/Sq Ft
Est. Value
About This Home
This home is located at 321 S Arlington Ave, Springfield, OH 45505 and is currently estimated at $139,252, approximately $101 per square foot. 321 S Arlington Ave is a home located in Clark County with nearby schools including Mann Elementary School, Schaefer Middle School, and Springfield High School.
Ownership History
Date
Name
Owned For
Owner Type
Purchase Details
Closed on
Nov 7, 2011
Sold by
Beach Christine D and Storts Christine D
Bought by
Beach Christine D and Beach David A
Current Estimated Value
Home Financials for this Owner
Home Financials are based on the most recent Mortgage that was taken out on this home.
Original Mortgage
$6,500
Interest Rate
3.97%
Mortgage Type
Stand Alone Second
Purchase Details
Closed on
Apr 8, 2004
Sold by
Goodlett Wayne C and Goodlett Jane
Bought by
Storts Christine D
Home Financials for this Owner
Home Financials are based on the most recent Mortgage that was taken out on this home.
Original Mortgage
$85,500
Outstanding Balance
$40,235
Interest Rate
5.66%
Mortgage Type
Purchase Money Mortgage
Estimated Equity
$99,017
Purchase Details
Closed on
Jun 21, 1993
Create a Home Valuation Report for This Property
The Home Valuation Report is an in-depth analysis detailing your home's value as well as a comparison with similar homes in the area
Home Values in the Area
Average Home Value in this Area
Purchase History
| Date | Buyer | Sale Price | Title Company |
|---|---|---|---|
| Beach Christine D | -- | None Available | |
| Storts Christine D | $90,000 | -- | |
| -- | $47,000 | -- |
Source: Public Records
Mortgage History
| Date | Status | Borrower | Loan Amount |
|---|---|---|---|
| Closed | Beach Christine D | $6,500 | |
| Open | Storts Christine D | $85,500 |
Source: Public Records
Tax History Compared to Growth
Tax History
| Year | Tax Paid | Tax Assessment Tax Assessment Total Assessment is a certain percentage of the fair market value that is determined by local assessors to be the total taxable value of land and additions on the property. | Land | Improvement |
|---|---|---|---|---|
| 2024 | $1,336 | $27,730 | $5,090 | $22,640 |
| 2023 | $1,336 | $27,730 | $5,090 | $22,640 |
| 2022 | $1,369 | $27,730 | $5,090 | $22,640 |
| 2021 | $1,258 | $23,520 | $3,570 | $19,950 |
| 2020 | $1,261 | $23,520 | $3,570 | $19,950 |
| 2019 | $1,264 | $23,520 | $3,570 | $19,950 |
| 2018 | $1,331 | $23,800 | $2,660 | $21,140 |
| 2017 | $1,330 | $23,797 | $2,660 | $21,137 |
| 2016 | $1,332 | $23,797 | $2,660 | $21,137 |
| 2015 | $1,458 | $25,550 | $2,660 | $22,890 |
| 2014 | $1,452 | $25,550 | $2,660 | $22,890 |
| 2013 | $1,436 | $25,550 | $2,660 | $22,890 |
Source: Public Records
Map
Nearby Homes
- 2201 Elmwood Ave
- 2027 Elmwood Ave
- 351 S Clairmont Ave
- 2201 E High St
- 500 S Belmont Ave Unit 502
- 2226 E High St
- 2345 Irwin Ave
- 2422 Lexington Ave
- 327 Buxton Ave
- 2434 Irwin Ave
- 360 Buxton Ave
- 535 S Hubert Ave
- 1701 Lexington Ave
- 26 N Belmont Ave
- 523 Linwood Ave
- 603 Linwood Ave Unit 605
- 1609 Irwin Ave
- 1726 Highland Ave
- 206-208 N Belmont Ave
- 196 Belleaire Ave
- 315 S Arlington Ave
- 325 S Arlington Ave
- 2127 Elmwood Ave Unit 2129
- 353 S Arlington Ave
- 320 S Douglas Ave
- 2117 Elmwood Ave
- 326 S Douglas Ave
- 2109 Elmwood Ave
- 357 S Arlington Ave
- 350 S Douglas Ave Unit 352
- 318 S Arlington Ave
- 2103 Elmwood Ave
- 314 S Arlington Ave
- 328 S Arlington Ave
- 360 S Douglas Ave
- 365 S Arlington Ave
- 352 S Arlington Ave
- 360 S Arlington Ave
- 2211 Elmwood Ave
- 364 S Douglas Ave