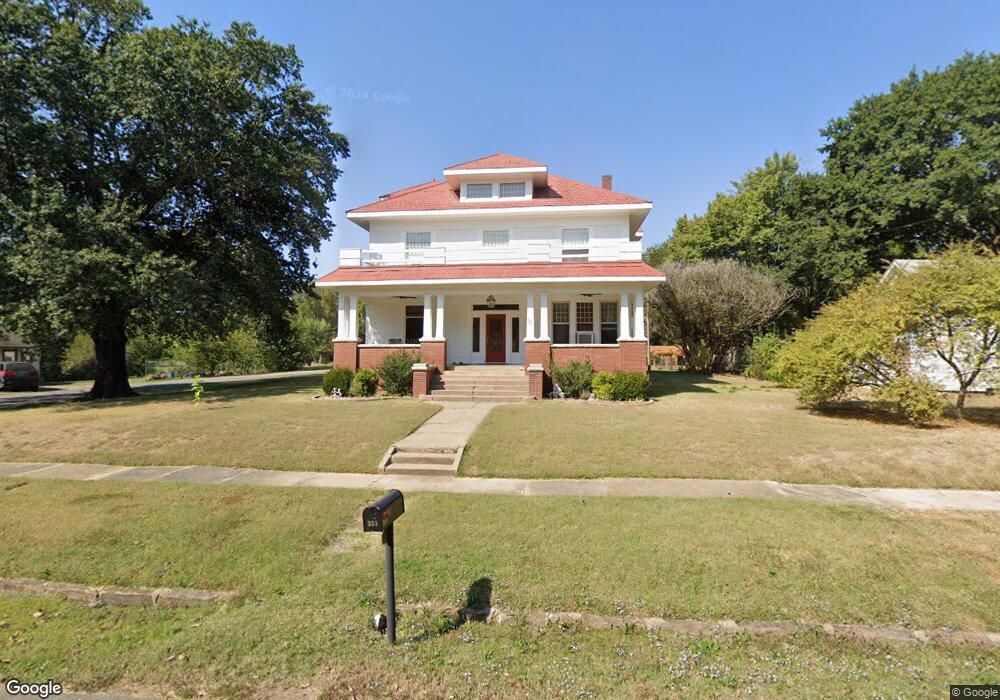
321 S Locust St Sallisaw, OK 74955
Estimated Value: $69,000 - $116,000
2
Beds
1
Bath
560
Sq Ft
$149/Sq Ft
Est. Value
About This Home
This home is located at 321 S Locust St, Sallisaw, OK 74955 and is currently estimated at $83,547, approximately $149 per square foot. 321 S Locust St is a home located in Sequoyah County with nearby schools including Liberty Elementary School, Eastside Elementary School, and Sallisaw Middle School.
Ownership History
Date
Name
Owned For
Owner Type
Purchase Details
Closed on
Jun 13, 2024
Sold by
Smallwood Randy C and Smallwood Sherry L
Bought by
Ulrich Properties Llc
Current Estimated Value
Home Financials for this Owner
Home Financials are based on the most recent Mortgage that was taken out on this home.
Original Mortgage
$52,700
Outstanding Balance
$32,115
Interest Rate
7.22%
Mortgage Type
New Conventional
Estimated Equity
$51,432
Purchase Details
Closed on
Jan 18, 2022
Sold by
T & R Investments Llc
Bought by
Smallwood Randy C and Smallwood Sherry L
Home Financials for this Owner
Home Financials are based on the most recent Mortgage that was taken out on this home.
Original Mortgage
$44,000
Interest Rate
2.33%
Mortgage Type
Commercial
Purchase Details
Closed on
Nov 5, 2001
Sold by
Jones Arlis and Jones Mary
Bought by
T & R Investments Llc
Purchase Details
Closed on
May 2, 1997
Sold by
Capps Lavelle
Bought by
Jolly Joe R
Create a Home Valuation Report for This Property
The Home Valuation Report is an in-depth analysis detailing your home's value as well as a comparison with similar homes in the area
Home Values in the Area
Average Home Value in this Area
Purchase History
| Date | Buyer | Sale Price | Title Company |
|---|---|---|---|
| Ulrich Properties Llc | $62,000 | Sca Title | |
| Smallwood Randy C | $55,000 | Valley Land Title | |
| T & R Investments Llc | $22,000 | -- | |
| Jolly Joe R | $18,000 | -- |
Source: Public Records
Mortgage History
| Date | Status | Borrower | Loan Amount |
|---|---|---|---|
| Open | Ulrich Properties Llc | $52,700 | |
| Previous Owner | Smallwood Randy C | $44,000 |
Source: Public Records
Tax History Compared to Growth
Tax History
| Year | Tax Paid | Tax Assessment Tax Assessment Total Assessment is a certain percentage of the fair market value that is determined by local assessors to be the total taxable value of land and additions on the property. | Land | Improvement |
|---|---|---|---|---|
| 2024 | $577 | $6,352 | $1,164 | $5,188 |
| 2023 | $577 | $6,051 | $1,084 | $4,967 |
| 2022 | $353 | $4,139 | $1,109 | $3,030 |
| 2021 | $336 | $4,139 | $1,109 | $3,030 |
| 2020 | $325 | $3,754 | $1,006 | $2,748 |
| 2019 | $313 | $3,575 | $958 | $2,617 |
| 2018 | $301 | $3,405 | $450 | $2,955 |
| 2017 | $286 | $3,242 | $428 | $2,814 |
| 2016 | $276 | $3,089 | $408 | $2,681 |
| 2015 | $267 | $2,942 | $389 | $2,553 |
| 2014 | $254 | $2,801 | $370 | $2,431 |
Source: Public Records
Map
Nearby Homes
- 322 S Locust St
- 205 W Port Arthur Ave
- TBD Chestnut St
- 200 E Scott Ave
- 218 W Chickasaw Ave
- 204 S Mulberry St
- 525 E Lucy Ave
- 402 S Ash St
- 0 Rural Route Unit 2535327
- 409 E Choctaw Ave
- 714 W Williams Ave
- 418 S Hickory St
- 402 S Cherry St
- 706 E Lucy Ave
- 701 E Chickasaw Ave
- 808 W Chickasaw Ave
- 204 W Denton Ave
- 703 E Ida Ave
- 711 E Lucy Ave
- 814 W Chickasaw Ave
- 321 S Locust St
- 121 E Delaware St
- 414 S Locust St
- 410 S Locust St
- 421 S Locust St
- 511 S Chestnut St
- 402 S Locust St
- 220 E Delaware St
- 411 S Locust St
- 507 S Locust St
- 519 S Chestnut St
- 323 E Vine Ave
- 323 E Vine Ave
- 323 E Vine Ave
- 401 S Locust St
- 212 E Shawnee St
- 713 S Chestnut St
- 515 S Locust St
- 412 S Elm St
- 516 S Chestnut St