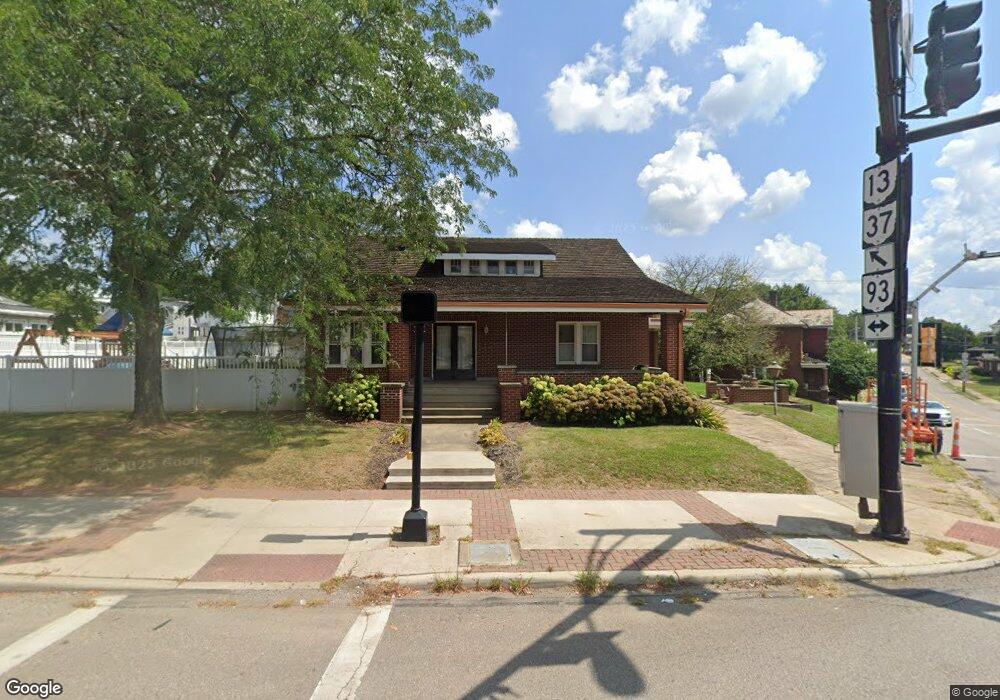
321 S Main St New Lexington, OH 43764
Estimated Value: $196,048 - $226,000
3
Beds
1
Bath
1,626
Sq Ft
$134/Sq Ft
Est. Value
About This Home
This home is located at 321 S Main St, New Lexington, OH 43764 and is currently estimated at $217,262, approximately $133 per square foot. 321 S Main St is a home located in Perry County with nearby schools including New Lexington Elementary School, Junction City Elementary School, and New Lexington Middle School.
Ownership History
Date
Name
Owned For
Owner Type
Purchase Details
Closed on
Jan 8, 2021
Sold by
Newlon Frank N and Newlon Joann
Bought by
Newlon Ross A
Current Estimated Value
Purchase Details
Closed on
Apr 30, 2020
Sold by
Newlon Frank N and Newlon Joann
Bought by
Newlon Ross A
Purchase Details
Closed on
Jan 21, 2019
Sold by
Newlon Frank N and Newlon Joann
Bought by
Newlon Ross A
Purchase Details
Closed on
Dec 27, 2018
Sold by
Newlon Frank N and Newlon Joann
Bought by
Newlon Ross A
Create a Home Valuation Report for This Property
The Home Valuation Report is an in-depth analysis detailing your home's value as well as a comparison with similar homes in the area
Home Values in the Area
Average Home Value in this Area
Purchase History
| Date | Buyer | Sale Price | Title Company |
|---|---|---|---|
| Newlon Ross A | -- | None Available | |
| Newlon Ross A | -- | None Available | |
| Newlon Ross A | -- | None Available | |
| Newlon Ross A | -- | None Available |
Source: Public Records
Tax History Compared to Growth
Tax History
| Year | Tax Paid | Tax Assessment Tax Assessment Total Assessment is a certain percentage of the fair market value that is determined by local assessors to be the total taxable value of land and additions on the property. | Land | Improvement |
|---|---|---|---|---|
| 2024 | $2,818 | $63,530 | $3,870 | $59,660 |
| 2023 | $2,818 | $63,530 | $3,870 | $59,660 |
| 2022 | $1,958 | $47,330 | $3,840 | $43,490 |
| 2021 | $1,858 | $47,330 | $3,840 | $43,490 |
| 2020 | $1,847 | $47,330 | $3,840 | $43,490 |
| 2019 | $1,657 | $42,100 | $3,590 | $38,510 |
| 2018 | $1,656 | $42,100 | $3,590 | $38,510 |
| 2017 | $1,628 | $42,100 | $3,590 | $38,510 |
| 2016 | $2,041 | $51,640 | $6,440 | $45,200 |
| 2015 | $2,037 | $51,640 | $6,440 | $45,200 |
| 2014 | $1,917 | $51,640 | $6,440 | $45,200 |
| 2013 | $1,954 | $51,640 | $6,440 | $45,200 |
| 2012 | -- | $51,640 | $6,440 | $45,200 |
Source: Public Records
Map
Nearby Homes
- 218 Park Ave
- 211 S High St
- 227 Park Ave
- 522 S Main St
- 500 Eastern Ave
- 604 Orchard Ave
- 403 Fowlers Ln
- 411 Fowlers Ln
- 200 N Main St
- 314 W Brown St
- 105 S Maple Heights
- 318 N Pleasant St
- 1893 Lovers Ln
- 524 Shawnee St
- 603 Shawnee St
- 551 W Brown St
- 139 E Jefferson St
- 221 W Broadway St
- 255 Kennedy Dr
- 418 W Broadway St Unit Rear
- 109 Mill St
- 315 S Main St
- 401 S Main St
- 111 Mill St
- 408 S Jackson St
- 414 S Jackson St
- 404 S Jackson St
- 400 S Jackson St
- 407 S Main St
- 318 S Main St
- 400 S Main St
- 310 S Jackson St
- 416 S Jackson St
- 404 S Main St
- 310&310 1/2 S Jackson St
- 119 Mill St
- 306 S Jackson St
- 411 S Main St
- 310 N Main St
- 304 S Jackson St