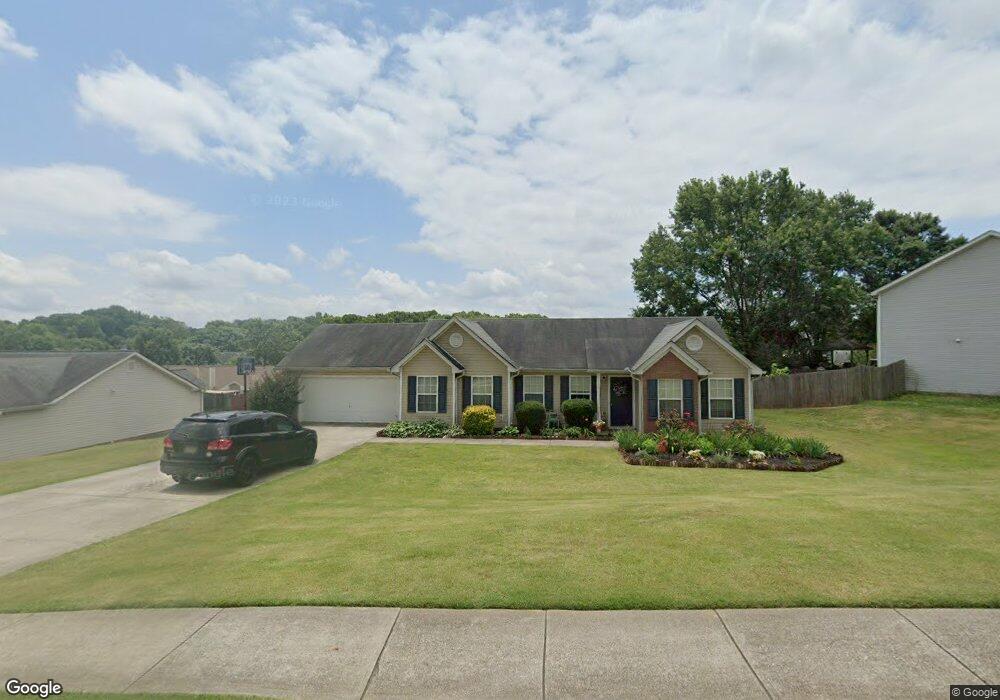
321 Shenandoah Cir Unit 2 Winder, GA 30680
Estimated Value: $293,000 - $311,398
3
Beds
2
Baths
1,354
Sq Ft
$221/Sq Ft
Est. Value
About This Home
This home is located at 321 Shenandoah Cir Unit 2, Winder, GA 30680 and is currently estimated at $299,850, approximately $221 per square foot. 321 Shenandoah Cir Unit 2 is a home located in Barrow County with nearby schools including County Line Elementary School, Russell Middle School, and Winder-Barrow High School.
Ownership History
Date
Name
Owned For
Owner Type
Purchase Details
Closed on
Jun 30, 2014
Sold by
Elizon Housing 2012 A1 Llc
Bought by
Sfr 2014 Ga Llc
Current Estimated Value
Purchase Details
Closed on
Nov 6, 2012
Sold by
Nichols Theodore L
Bought by
Elizon Housing 2012 A1 Llc and C/O Ellington Management Grp
Purchase Details
Closed on
Aug 27, 2003
Sold by
Valuecraft Hms Inc
Bought by
Nichols Theordore L
Home Financials for this Owner
Home Financials are based on the most recent Mortgage that was taken out on this home.
Original Mortgage
$111,549
Interest Rate
5.94%
Mortgage Type
FHA
Purchase Details
Closed on
Mar 26, 2003
Sold by
Denney Construction
Bought by
Valuecraft Homes Inc
Purchase Details
Closed on
Jan 24, 2002
Sold by
Shenandoah Partners
Bought by
Denney Construction
Purchase Details
Closed on
Apr 5, 2001
Bought by
Shenandoah Partners
Create a Home Valuation Report for This Property
The Home Valuation Report is an in-depth analysis detailing your home's value as well as a comparison with similar homes in the area
Home Values in the Area
Average Home Value in this Area
Purchase History
| Date | Buyer | Sale Price | Title Company |
|---|---|---|---|
| Sfr 2014 Ga Llc | -- | -- | |
| Elizon Housing 2012 A1 Llc | $66,200 | -- | |
| Nichols Theordore L | $113,300 | -- | |
| Valuecraft Homes Inc | $114,000 | -- | |
| Denney Construction | $300,000 | -- | |
| Shenandoah Partners | -- | -- |
Source: Public Records
Mortgage History
| Date | Status | Borrower | Loan Amount |
|---|---|---|---|
| Previous Owner | Nichols Theordore L | $111,549 |
Source: Public Records
Tax History Compared to Growth
Tax History
| Year | Tax Paid | Tax Assessment Tax Assessment Total Assessment is a certain percentage of the fair market value that is determined by local assessors to be the total taxable value of land and additions on the property. | Land | Improvement |
|---|---|---|---|---|
| 2024 | $2,912 | $102,861 | $23,200 | $79,661 |
| 2023 | $2,625 | $92,854 | $22,000 | $70,854 |
| 2022 | $1,966 | $56,604 | $12,000 | $44,604 |
| 2021 | $2,085 | $56,604 | $12,000 | $44,604 |
| 2020 | $1,988 | $56,604 | $12,000 | $44,604 |
| 2019 | $2,015 | $56,604 | $12,000 | $44,604 |
| 2018 | $1,771 | $49,345 | $10,000 | $39,345 |
| 2017 | $1,164 | $39,014 | $10,000 | $29,014 |
| 2016 | $1,143 | $33,080 | $6,372 | $26,708 |
| 2015 | $1,154 | $33,376 | $6,372 | $27,004 |
| 2014 | $1,161 | $33,376 | $6,076 | $27,300 |
| 2013 | -- | $32,042 | $6,076 | $25,966 |
Source: Public Records
Map
Nearby Homes
- 315 Shenandoah Cir
- 323 Shenandoah Cir Unit 2
- 508 Shenandoah Ln Unit 2
- 508 Shenandoah Ln
- 506 Shenandoah Ln Unit 2
- 500 Shenandoah Ln
- 313 Shenandoah Cir
- 320 Shenandoah Cir Unit 2
- 322 Shenandoah Cir
- 510 Shenandoah Ln
- 510 Shenandoah Ln Unit 2
- 318 Shenandoah Cir
- 325 Shenandoah Cir
- 316 Shenandoah Cir
- 324 Shenandoah Cir
- 314 Shenandoah Cir
- 314 Shenandoah Cir Unit 2
- 512 Shenandoah Ln
- 512 Shenandoah Ln
- 512 Shenandoah Ln