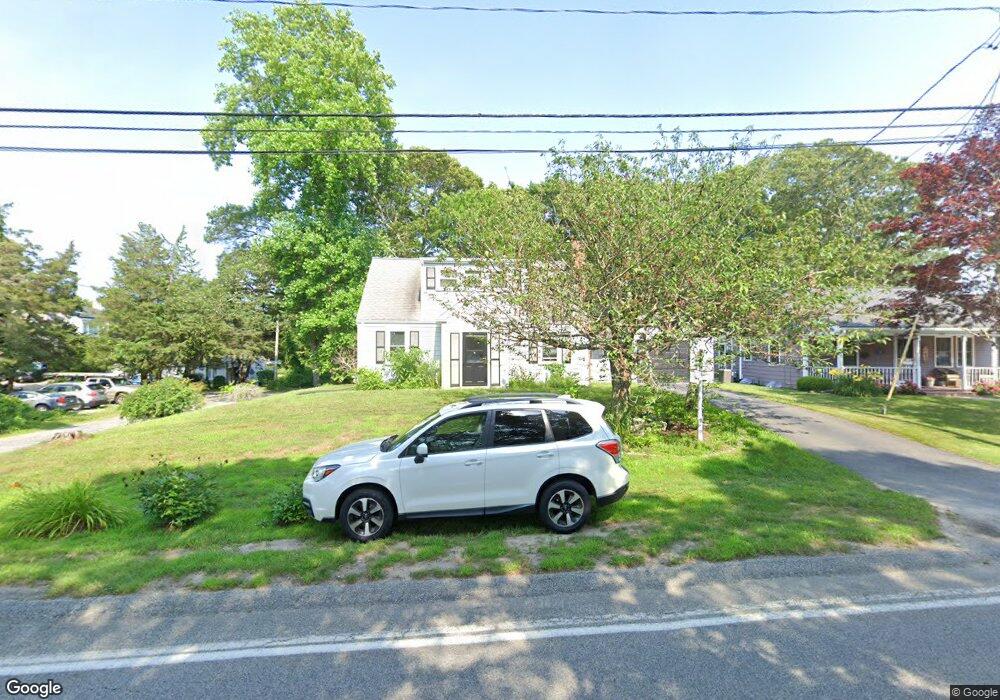
321 Shore Rd Bourne, MA 2532
Monument Beach NeighborhoodEstimated Value: $623,000 - $663,862
3
Beds
3
Baths
2,037
Sq Ft
$314/Sq Ft
Est. Value
About This Home
This home is located at 321 Shore Rd, Bourne, MA 2532 and is currently estimated at $639,216, approximately $313 per square foot. 321 Shore Rd is a home located in Barnstable County with nearby schools including Bourne High School, St Margaret Regional School, and Cadence Academy Preschool - Bourne.
Ownership History
Date
Name
Owned For
Owner Type
Purchase Details
Closed on
Feb 21, 2020
Sold by
Vigeant Marc J
Bought by
Osborne Deborah A
Current Estimated Value
Home Financials for this Owner
Home Financials are based on the most recent Mortgage that was taken out on this home.
Original Mortgage
$215,000
Outstanding Balance
$189,145
Interest Rate
3.6%
Mortgage Type
New Conventional
Estimated Equity
$450,071
Purchase Details
Closed on
Jan 28, 2020
Sold by
Vigeant Marc J and Vigeant Sandra L
Bought by
Vigeant Marc J
Home Financials for this Owner
Home Financials are based on the most recent Mortgage that was taken out on this home.
Original Mortgage
$215,000
Outstanding Balance
$189,145
Interest Rate
3.6%
Mortgage Type
New Conventional
Estimated Equity
$450,071
Purchase Details
Closed on
Jul 1, 2014
Sold by
Turner Blanche L
Bought by
Vigeant Marc J and Vigeant Sandra L
Home Financials for this Owner
Home Financials are based on the most recent Mortgage that was taken out on this home.
Original Mortgage
$243,675
Interest Rate
3%
Mortgage Type
New Conventional
Purchase Details
Closed on
Aug 2, 2013
Sold by
Oakley Cheryl J and Iselin Deborah S
Bought by
Turner Blanche L
Purchase Details
Closed on
Oct 8, 2009
Sold by
Turner Blanche L
Bought by
Oakley Cheryl Jeanne and Iselin Deborah Suzanne
Create a Home Valuation Report for This Property
The Home Valuation Report is an in-depth analysis detailing your home's value as well as a comparison with similar homes in the area
Home Values in the Area
Average Home Value in this Area
Purchase History
| Date | Buyer | Sale Price | Title Company |
|---|---|---|---|
| Osborne Deborah A | $327,500 | None Available | |
| Vigeant Marc J | -- | None Available | |
| Vigeant Marc J | $256,500 | -- | |
| Vigeant Marc J | $256,500 | -- | |
| Turner Blanche L | -- | -- | |
| Turner Blanche L | -- | -- | |
| Turner Blanche L | -- | -- | |
| Oakley Cheryl Jeanne | -- | -- | |
| Oakley Cheryl Jeanne | -- | -- |
Source: Public Records
Mortgage History
| Date | Status | Borrower | Loan Amount |
|---|---|---|---|
| Open | Osborne Deborah A | $215,000 | |
| Previous Owner | Vigeant Marc J | $243,675 |
Source: Public Records
Tax History
| Year | Tax Paid | Tax Assessment Tax Assessment Total Assessment is a certain percentage of the fair market value that is determined by local assessors to be the total taxable value of land and additions on the property. | Land | Improvement |
|---|---|---|---|---|
| 2025 | $4,060 | $519,900 | $201,400 | $318,500 |
| 2024 | $3,971 | $495,100 | $191,800 | $303,300 |
| 2023 | $3,864 | $438,600 | $169,800 | $268,800 |
| 2022 | $3,675 | $364,200 | $150,200 | $214,000 |
| 2021 | $3,885 | $360,700 | $136,700 | $224,000 |
| 2020 | $3,667 | $341,400 | $135,400 | $206,000 |
| 2019 | $3,348 | $318,600 | $123,700 | $194,900 |
| 2018 | $3,202 | $303,800 | $117,800 | $186,000 |
| 2017 | $3,098 | $300,800 | $116,700 | $184,100 |
| 2016 | $2,646 | $260,400 | $116,700 | $143,700 |
| 2015 | $2,622 | $260,400 | $116,700 | $143,700 |
Source: Public Records
Map
Nearby Homes
- 203 County Rd
- 35 Benedict Rd
- 13 Laurel Hill Ct
- 5 Zoli Ln
- 12 Turnberry Rd Unit 12
- 5 Sea Knoll Ct
- 16 Amberwood Ct
- 60 Bourne Neck Dr
- 566 Shore Rd
- 4 Hollyhock Knoll Ct Unit 4
- 4 Hollyhock Knoll Ct Unit 4
- 1 Hollyhock Knoll Ct Unit 1
- 4 Harbor Hill Dr
- 44 Cotuit Rd
- 46 Holt Rd Unit B
- 46 Holt Rd
- 20 Colony Ave
- 60 Sandwich Rd
- 10 Sandy Ln
- 40-A Lafayette Ave
Your Personal Tour Guide
Ask me questions while you tour the home.